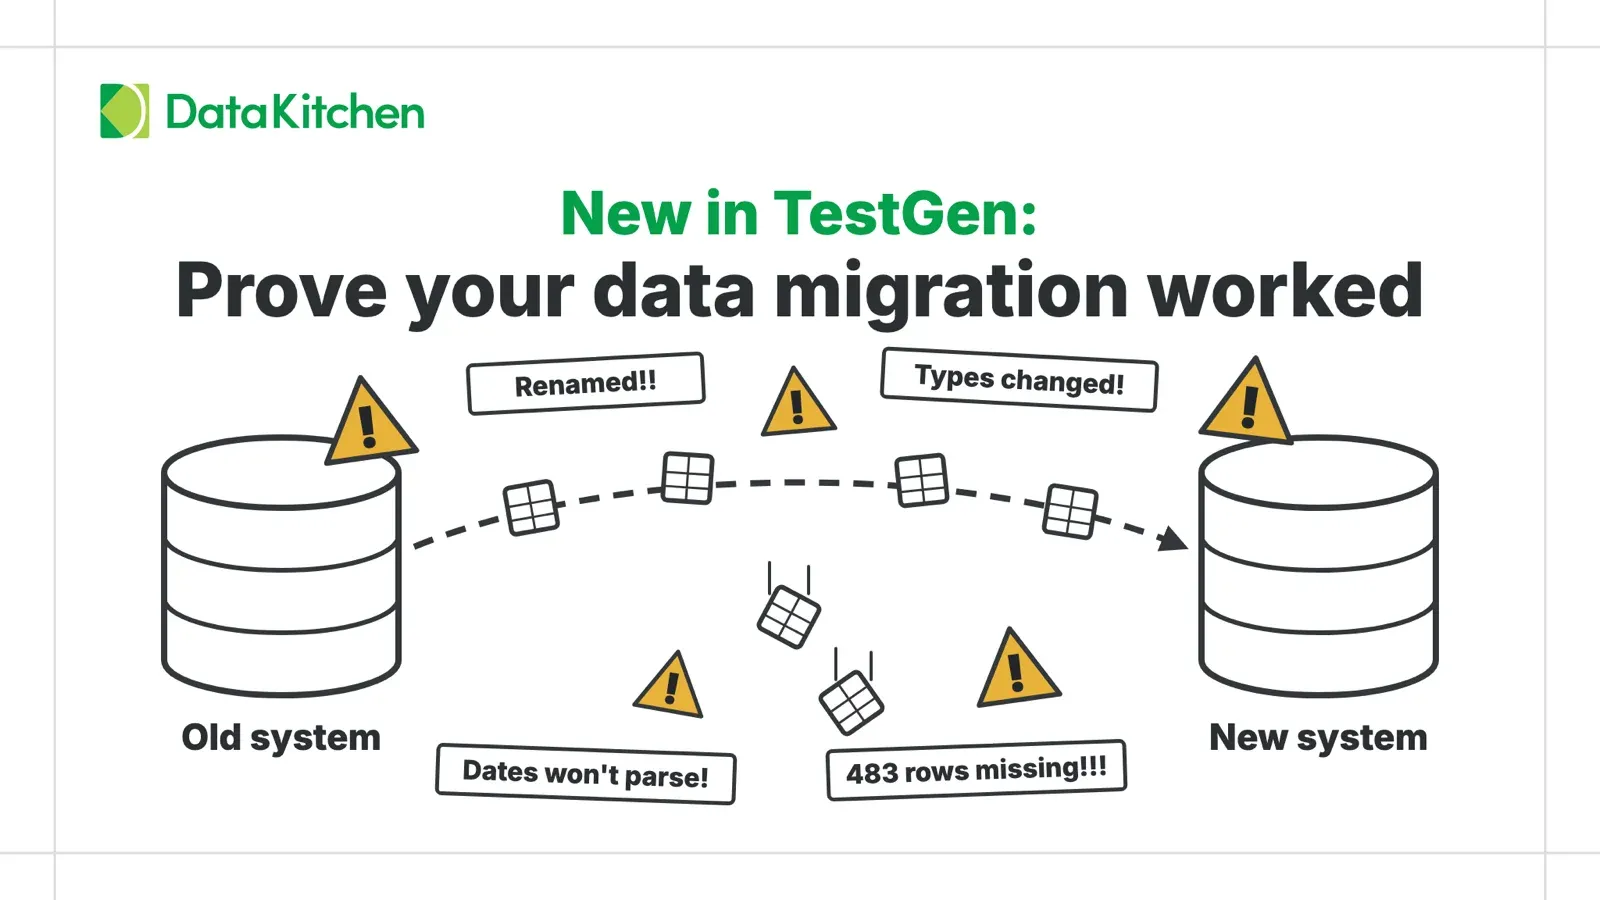
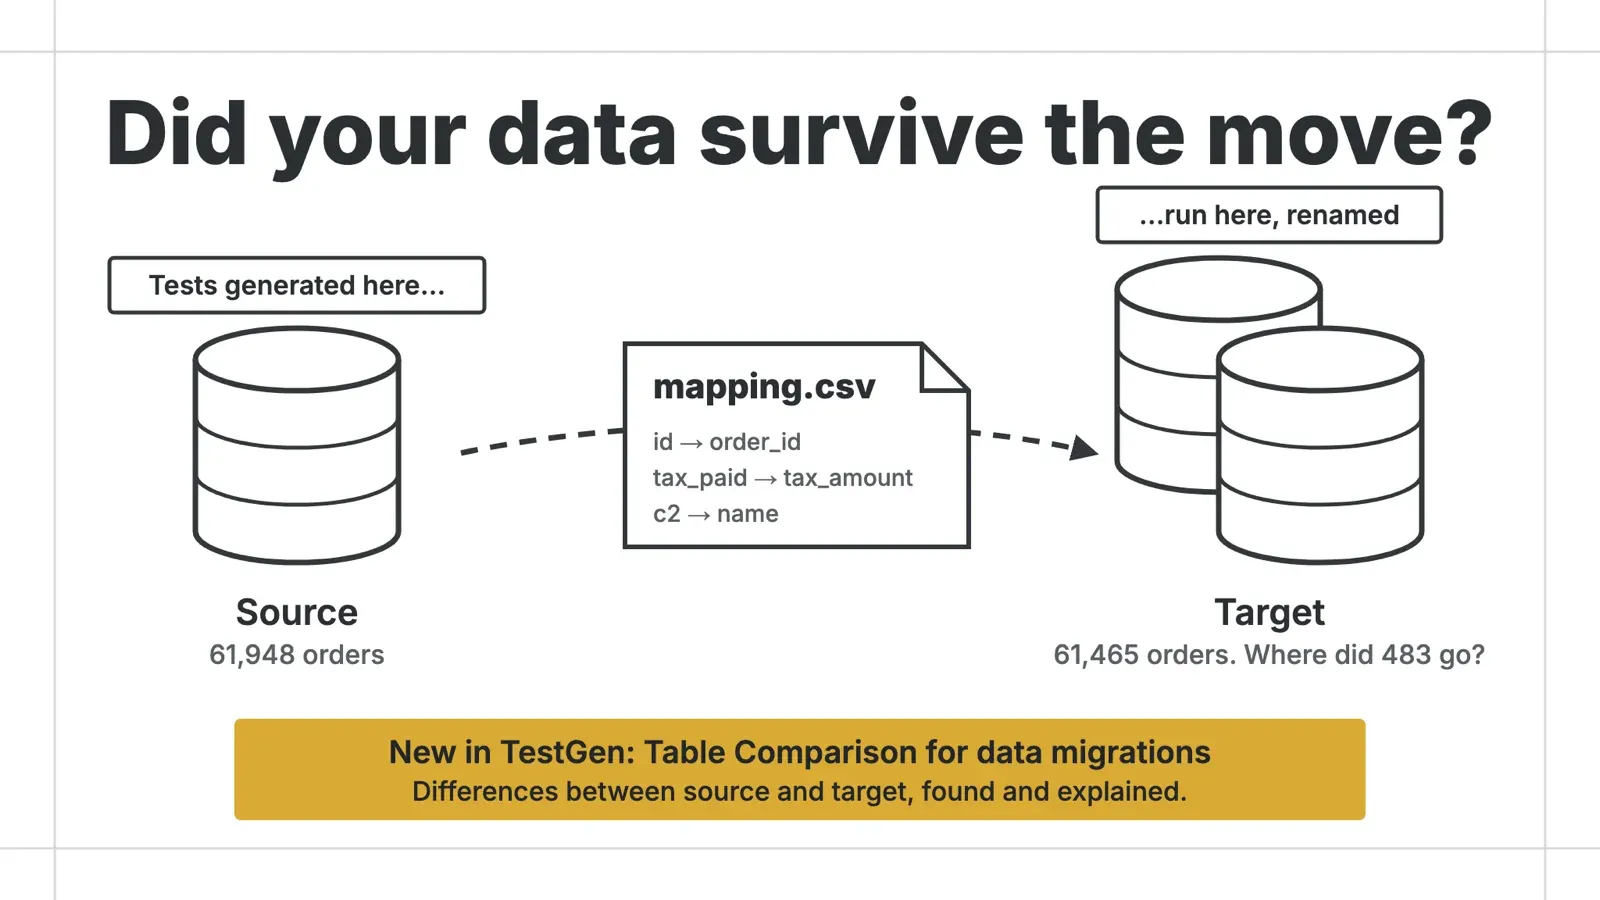
On October 14 we released a new feature in TestGen for data migration quality, in both the free open source version and TestGen Enterprise. It profiles your source data and turns that profile into tests. Then it carries those tests to the target, even when the tables and columns have new names or the target runs on a different database. Run them there and they show you which tables and columns no longer match the source.
To show it working, we migrated a small database on purpose this week. On the way over we fixed some real hygiene problems, split one table in two, and left 483 orders behind.
Then we ran the usual test suite on the new database. 55 tests. Zero failures.
That suite was not broken. It checks whether data looks healthy: no blanks, no duplicate keys, values in range. The migrated data did look healthy. It was just missing 483 rows, and nothing in a health check knows what used to be there.
A migration needs a different question: is this the same data I started with, except for the changes I meant to make? The new Table Comparison generation feature answers that one. On the same migration its tests failed 61 times, and every failure pointed at a change we made.
Why migrations are hard to prove
You’re moving data from one system to another. An old ERP into Workday. SQL Server into Snowflake. Three warehouses from a merger into one. Everyone calls it a migration, as if the job were loading boxes onto a truck. It isn’t. Almost nothing arrives in the same shape it left.
Fields get renamed. A status column with seven codes becomes two columns with four. Free-text fields that people have used as structured data for 15 years need to become real structured data. The Smith account turns out to be two customers. Dates stored as text get parsed, and 3% of them don’t parse. And on top of all the mapping and reshaping, somebody decides this is the moment to fix the source data. Deduplicate it. Standardize the addresses. Finally retire the 2014 product codes. So you’re doing three things at once: moving the data, adapting it to a new model, and improving it. Each one can break the other two.
The track record is bad. Gartner puts migration failure at 83%, Bloor Research says more than 60% blow their time or budget, and McKinsey’s survey of 450 CIOs found only 15% of cloud migrations finished on time and on budget. QuerySurge reports a 30% average cost overrun and says 34% of migrations lose data outright. About a third of the budget ends up spent on fixing data problems that nobody budgeted for.
The reason is simple. Your legacy data has problems, and you don’t find them until the new system refuses to load them. Oracle’s migration white paper named this years ago: teams treat migration as a one-time IT event, skip the business involvement, and discover the quirks in the data after the schedule is already set. The old system tolerated those quirks because the people and reports around it had adapted. The new system has no such patience.
Then there’s the question nobody answers well: how do you know the data is right? Most projects check that row counts match. That tells you the data arrived. It doesn’t tell you the balances tie, the relationships held, or the business rules survived the mapping. Validation and reconciliation are different jobs, and reconciliation at the value and rule level is the part that gets cut when the schedule slips. Manual validation doesn’t scale past a few dozen tables, and scripted checks written for one cutover get run once and thrown away. Meanwhile the source system is still live, so whatever you validated Monday is stale by Tuesday.
Steve Munson, CIO at American University, and Lwanga Yonke of Padouk Consulting gave a talk at DGIQ + EDW 2025 on exactly this, drawn from AU’s Workday rollout. Their answer: make the business co-owners of the data, run mock loads starting in design rather than at the end, and measure quality after every cycle two ways. Count defects by severity, and survey the people who know the data on whether they trust what they see. Quality becomes something the CIO can read off a trend line instead of a feeling in the room before Go Live.
That’s the gap this post is about. Moving data is a solved engineering problem. Moving it, reshaping it, and improving it at the same time, with proof that it worked, is not.
The Table Comparison test set
TestGen generates tests in sets. The Standard set checks data health, the kind of test coverage every pipeline needs. The Table Comparison set checks sameness: profile the source, and every test records what the source looked like as a baseline. Run those tests against the target and each one asks whether the target still matches. There are 32 test types in the set, every one an exact match against its baseline except Match Standard Deviation and, on floating-point columns, Match Sum, which allow a tiny relative tolerance.
TestGen picks which ones a column gets from the source profile. A text column gets length and pattern tests, a date column gets date tests, and so on.
| Family | Test types | A failure usually means |
|---|---|---|
| Table | Row Count, Column Count | Rows lost or added; columns added or dropped |
| Every column | Column Type, Null Count, Distinct Count | A retype, values turned to nulls, values merged or split |
| Numbers | Min, Max, Zero Count, Sum, Standard Deviation, Fractional Sum | Changed amounts, nulls turned to zeros, rounding or truncation |
| Dates | Min Date, Max Date, Distinct Date Count | Dates clipped, or shifted across a time zone |
| Booleans | True Count | Flags flipped |
| Text | Min, Max and Total Length; Leading Spaces, Empty Strings, Upper Case and Non-Printing counts; Frequent Patterns; Distinct Hash; Frequent Values | Truncation, trimming, case changes, stray characters, a changed set of codes |
| Value hashes | Text, Numeric and Date Hash; Epoch Sum | Any value changed, even to one of the same length |
| Keyed hashes | Keyed Text, Numeric and Date Hash | A value moved to a different row |
The last two rows are the newest and the strongest. With Profile for table comparison turned on, profiling hashes every value and stores the sum for each column, computed in the database. Change one character in one row of a million and the sum moves. The keyed version hashes each value together with the row’s key, which TestGen infers from the profile, so it catches two values that swapped rows while every count and total stays the same.
The tests work across databases, including the cross-engine moves most migrations make. Our example moved Postgres to Postgres, but most real migrations change engines: SQL Server to Snowflake, Oracle to Databricks, an on-premises warehouse to BigQuery. The tests are generated from the source’s profile and run as SQL on the target, so the suite you build on SQL Server runs on Snowflake after the transfer. The value hashes are canonical across engines: numbers round to six decimal places and dates truncate to the second in UTC, so the same value hashes the same way on both sides. Hashing works on every database TestGen supports, including Oracle and BigQuery, and on DuckDB and file data sources. The two exceptions are SAP HANA and Salesforce Data 360, where the hash tests are not generated.
A few differences between engines show up as failures on a correct copy, and the TestGen docs list them. For text hashes, SQL Server must support UTF-8 collations: SQL Server 2019 or later, or Azure SQL. A case-insensitive collation on one side only changes Distinct Count, and SQL Server treats values that differ only in trailing spaces as one distinct value. Oracle pads CHAR columns. CSV files read an empty field as a null where a database keeps an empty string. When one of these fires, deactivate that test on the target instead of loosening it.
The example: Jaffle Shop moves house
The source is Jaffle Shop, the dbt demo coffee-and-toastie chain, loaded into Postgres as six raw tables: 935 customers, 61,948 orders, 90,900 order line items, 10 products, 6 stores and 65 supply rows. The target is another Postgres database, jaffle_shop_target, built from it by one SQL script. We kept both sides on Postgres to keep the example small. Your target can be a different database: build the suite on SQL Server and the same tests run on Snowflake.
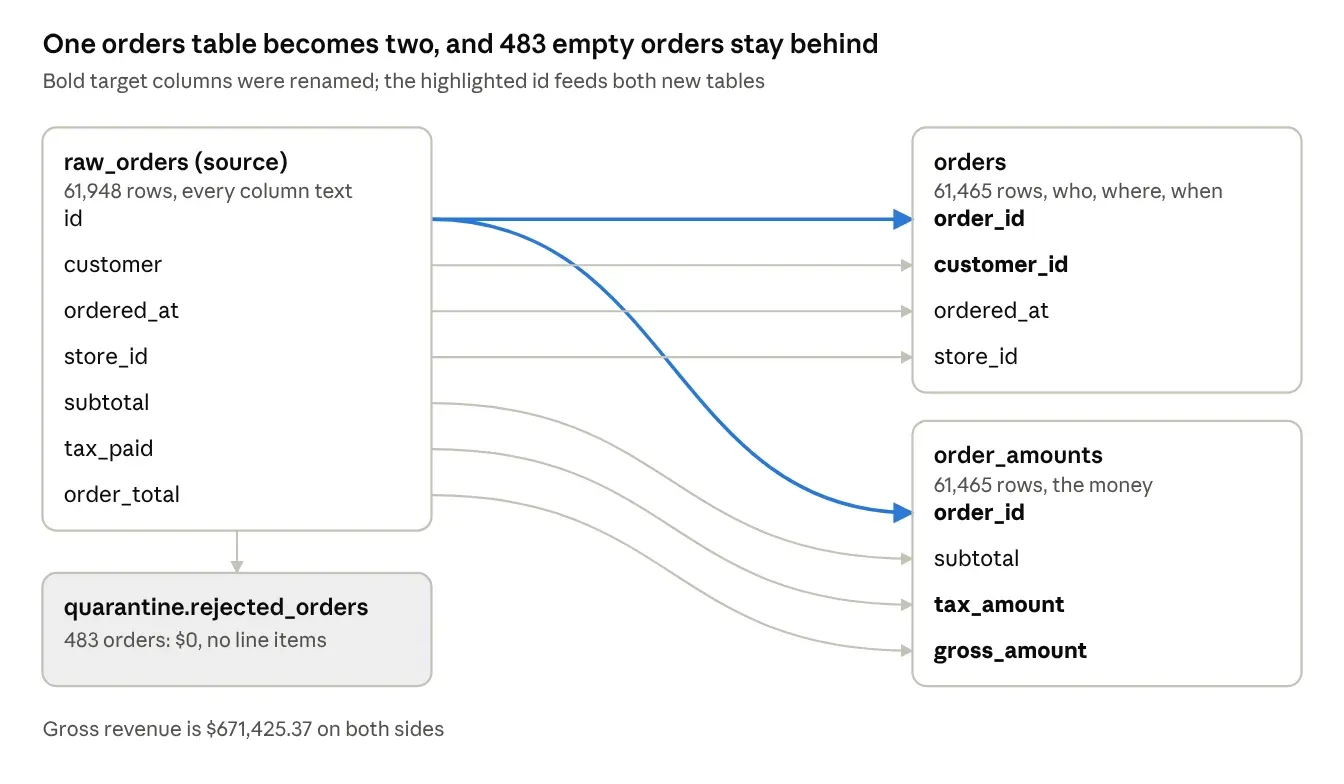
We changed one table’s shape. raw_orders became two tables: orders keeps who, where and when, and order_amounts keeps the money. Along the way three columns got new names.
| Source | Target |
|---|---|
raw_orders.id | orders.order_id |
raw_orders.customer | orders.customer_id |
raw_orders.store_id, ordered_at | orders, same names |
raw_orders.subtotal | order_amounts.subtotal |
raw_orders.tax_paid | order_amounts.tax_amount |
raw_orders.order_total | order_amounts.gross_amount |
The other five tables kept their names. They did not keep their problems. TestGen’s profile of the source flagged three hygiene issues, and none of them was the real trouble. Querying the data turned up these:
| Problem in the source | Rows | Fix in the target |
|---|---|---|
CSV header row loaded as data in raw_customers and raw_items, under columns named c1, c2, c3 | 2 | Rows removed, columns named id, name, order_id, sku |
| Orders with a $0 subtotal and no line items | 483 | Moved to quarantine.rejected_orders, not migrated |
| Trailing spaces in a product name and a product description | 2 | Trimmed |
| UUIDs, timestamps, amounts and a True/False flag all stored as text | every row | Typed as uuid, timestamp, integer and boolean |
| No primary or foreign keys anywhere | 6 tables | Keys added; raw_supplies gets a two-column key because its id repeats once per product |
| Order totals not enforced | 61,465 | CHECK subtotal + tax = gross |
The books still balance. 61,948 source orders = 61,465 migrated + 483 quarantined, and gross revenue is $671,425.37 on both sides.
Tests written against old names, run against new ones
The Table Comparison tests are generated from the source’s profile, so they carry source names: raw_orders.id, raw_customers.c2. The target calls those columns something else. Rewriting 345 test definitions by hand is how you get a migration test suite with its own bugs.
So the mapping lives in a four-column CSV, and a script does the rewrite. scripts/transfer_tests.py in the TestGen repo exports the source suite through the API, renames tables and columns from the CSV, previews the import into a suite on the target, and with --apply imports it. It runs on plain Python 3.11 or later, with no TestGen install needed.
This is the mapping for our migration:
source_table,source_column,target_table,target_column
raw_orders,,orders,
raw_orders,id,orders,order_id
raw_orders,customer,orders,customer_id
raw_orders,subtotal,order_amounts,subtotal
raw_orders,tax_paid,order_amounts,tax_amount
raw_orders,order_total,order_amounts,gross_amount
raw_customers,c1,raw_customers,id
raw_customers,c2,raw_customers,name
raw_items,c1,raw_items,id
raw_items,c2,raw_items,order_id
raw_items,c3,raw_items,sku
The rules are short. A row with a blank source_column renames a table. A column row renames the column and places it in its target table, which is how three columns move from raw_orders into order_amounts. DROP in target_column drops the tests on a column you are retiring. DROP_ALL in target_table retires a table, and DROP there keeps the table’s tests but leaves out its row-count and column-count tests. A column with no row keeps its name and follows its table. And the mapping is optional. If nothing was renamed, the CSV holds only its header row and the script moves the tests over as they are.
The script is strict, and it was right every time it said no. It refused our first mapping because it listed raw_orders under two target tables. When a column moves to another table, it drops the column-count test on both tables, because neither count can match any more. And it writes a plain-text report of every rename and every dropped test, so the person approving the import can read what changed.
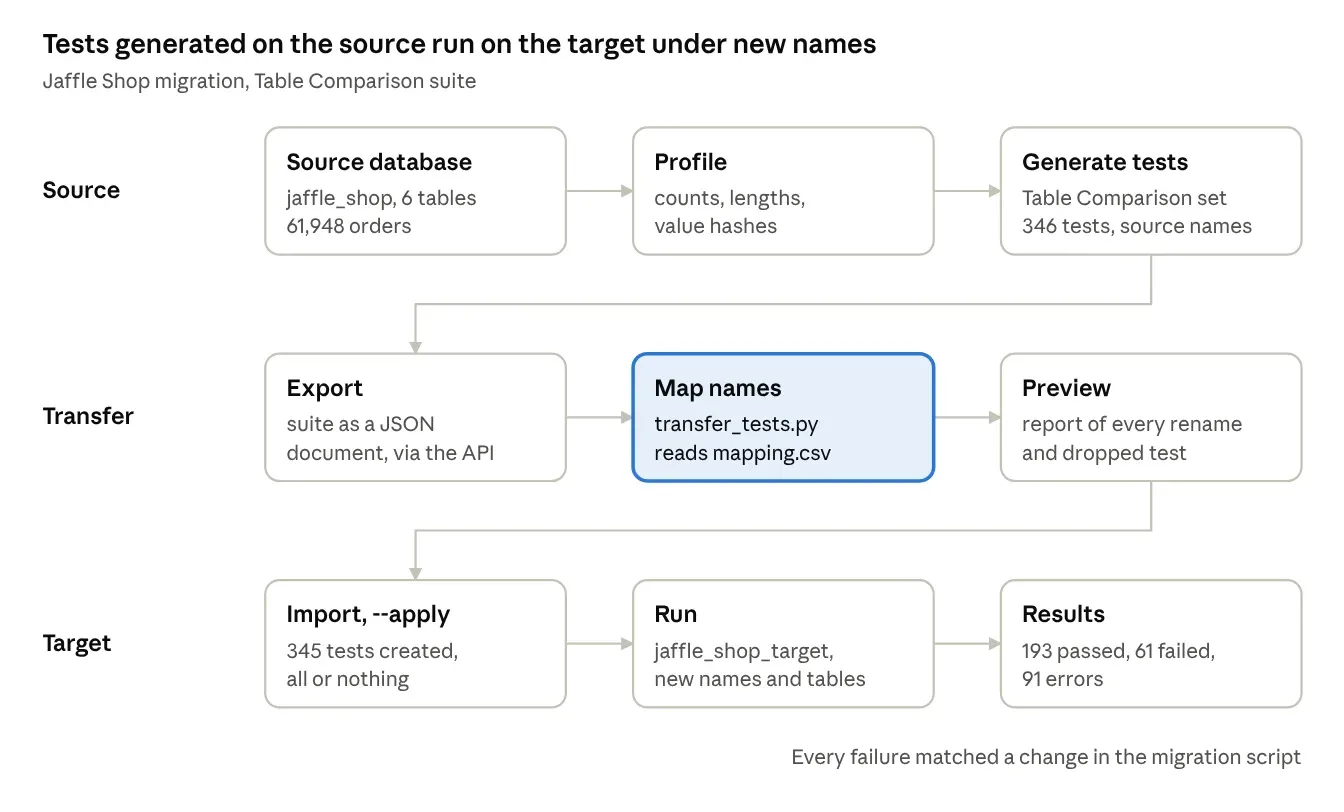
The only step a person writes is the mapping, and only when names changed. Everything else is the script and TestGen.
What the tests found
We ran two suites on the target, each moved over with the same mapping.
| Suite on the target | Tests | Passed | Failed | Errors |
|---|---|---|---|---|
| Standard generated suite (health checks) | 55 | 36 | 0 | 19 |
| Table Comparison suite | 345 | 193 | 61 | 91 |
The standard suite saw nothing wrong, as the opening said. The Table Comparison suite failed 61 times. We matched each failure against the migration script, and every one traces to a change we made on purpose. No surprises. That is what a clean migration looks like.
| Change we made | Main tests that caught it |
|---|---|
| 483 empty orders left in quarantine | Row Count on orders (61,465 against a baseline of 61,948); Distinct Count on order_id and ordered_at; Total Length on order_id, customer_id and store_id (483 × 36 characters short) |
The $0 orders also took the only 0 subtotal, tax and total | Distinct Count down by one and Minimum Length up on subtotal, tax_amount, gross_amount |
Header rows removed from raw_customers and raw_items | Row Count off by one on each; Distinct Count, Minimum Length and Total Length on every renamed column; Text Hash on name; Distinct Hash and Frequent Patterns on sku |
| Trailing spaces trimmed on two products | Text Hash, Keyed Text Hash, Maximum Length and Total Length on raw_products.name and description; Frequent Values on name |
| 13 columns retyped from text | Match Column Type on each one: uuid, timestamp, integer, boolean |
Two trailing spaces in a 10-row table set off 9 failing tests. A length check sees one missing character. A hash sees any change at all, even one that keeps the length.
Just as useful is what passed. Store names, product prices, supply costs and every value in raw_supplies matched their baselines. When those pass, you know the tables nobody meant to touch came over unchanged.
What this won’t do for you
This is not a cell-by-cell, row-by-row comparison. A true row diff needs both copies of the data in one place, which means copying the source into the target system or pulling both out to a third. Table Comparison never moves the data. It profiles the source where it lives, runs the tests as queries on the target where it lives, and compares the results: counts, lengths, sums, patterns, and a hash of each column’s values. That’s why it works across database engines and on big tables. The trade-off is that a failure tells you which column changed, not which row.
Tests plus column hashes still catch the vast majority of migration errors. In our testing on three public datasets with 785 changes planted on purpose, they caught 774. The 11 misses were binary columns, type changes that stay inside the same general type, and values swapped across a composite key. The docs name two more: values swapped between rows of a table with no key column, and numeric changes that disappear when the value is rounded to six decimal places. If your migration risks one of those, add a specific test for it.
Two practical notes from our run. Retyping a column turns its text-only tests into errors: all 91 of ours were type changes that Match Column Type had already flagged, so deactivate them on the target. And a column that feeds two target tables, like our raw_orders.id, needs a second mapping file for the hash tests keyed on it.
Proof instead of a feeling before Go Live
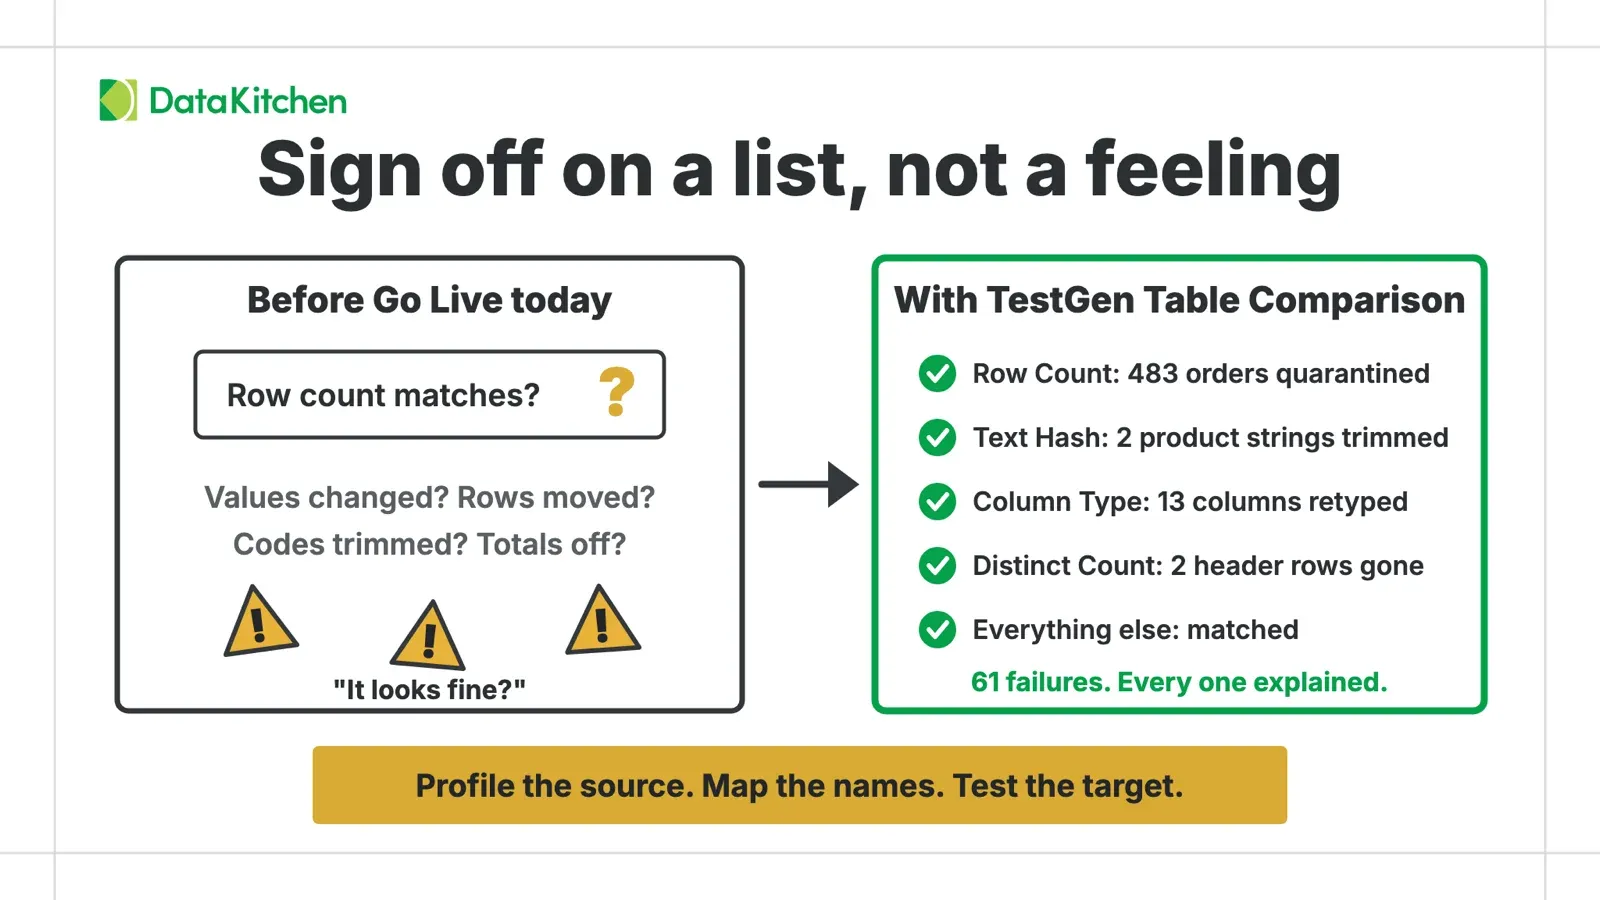
A migration does three jobs at once. It moves the data, reshapes it for a new model, and cleans it up, and each job can break the other two. Most teams check the result with a row count and some hope. A row count tells you the data arrived. It doesn’t tell you a value changed, a code got trimmed, or the totals moved while the count stayed put.
Table Comparison is built for that gap. Profile the source once and TestGen records what every column looked like: counts, lengths, sums, patterns, and a hash of every value. The transfer script carries those tests to the target under their new names, so reshaping the model doesn’t mean rewriting the tests. Run them, and a changed count, length, total or value shows up as a failed test, with the source value next to the target value.
That is the reconciliation work that gets cut when the schedule slips, and it’s cheap enough to keep. Our 345 tests ran in five seconds, so they can run after every mock load instead of once at cutover. When the source keeps changing, re-profile it, regenerate the source suite, and rerun the transfer with --delete-absent to refresh the baselines. Monday’s validation doesn’t have to be stale by Tuesday.
The cleanup shows up too, which is the point. In the Jaffle Shop run, all 61 failures were the hygiene fixes and the restructure we planned, and nothing else. When the failures match your change list line for line, you have proof the migration did what you meant.
TestGen can’t decide which differences you intended. Your migration script and the people who know the data still do that. What changes is what they sign off on: a list of every difference, each one explained, instead of a feeling in the room before Go Live. It works the way a data contract does: a receipt you can check.
Related reading
| Resource | What it is | Reach for it when |
|---|---|---|
| Verify a Data Migration | Documentation | You are ready to set up the workflow on your own data |
| TestGen open source release notes, 14 October 2026 | Release notes | You run the free version and want everything else in this release |
| TestGen Enterprise release notes, 14 October 2026 | Release notes | You run TestGen Enterprise and want everything else in this release |
| How DataOps Facilitates Your Cloud Migration | Blog post | You are planning the migration itself, not only the testing |
| The First Move When You Inherit Someone Else's Data | Blog post | The source system is new to you and you don't know its quirks yet |
| Scaling Data Reliability: The Definitive Guide to Test Coverage for Data Engineers | Blog post | The target is live and needs everyday tests, not only comparison tests |
| The Syntax, Semantics, and Pragmatics Gap in Data Quality Validation Testing | Blog post | The data matches the source but you still need to know it is right for the business |
| The Data Contract Is Your Receipt | Blog post | You want the sign-off to keep holding after cutover |
FAQ
What are the key points in this blog?
On October 14, 2026, DataKitchen released Table Comparison tests in TestGen open source and TestGen Enterprise for data migration quality. TestGen profiles the source, generates tests from that profile, and a mapping CSV carries them to the target under new names. In a Jaffle Shop example, a 55-test health-check suite passed after 483 orders were dropped. The 345-test Table Comparison suite failed 61 times, and every failure matched a planned change.
How do I set up a migration test in TestGen?
Profile the source with Profile for table comparison turned on and sampling turned off, then generate the Table Comparison set into a suite on the source. Create an empty suite on the target, write a mapping CSV of any renamed tables and columns (only the header row if nothing was renamed), and run transfer_tests.py to preview the import. Run it again with —apply, then run the suite on the target and match each failure to a change in your migration script.
Can I test a migration where tables and columns were renamed or moved?
Yes. A four-column mapping CSV, with source_table, source_column, target_table and target_column, tells the transfer_tests.py script how to rename the source tests for the target, including columns that moved to a different table. The script previews every rename and dropped test before it imports anything, and the import is all or nothing.
Does it work when the source and target are different databases?
Yes. For example, a suite built on SQL Server runs on Snowflake after the transfer, because the tests run as SQL on each side and compare against baselines from the source profile. TestGen computes value hashes the same way on every database it supports except SAP HANA and Salesforce Data 360, and on DuckDB and file data sources. For text hashes, SQL Server must support UTF-8 collations: SQL Server 2019 or later, or Azure SQL.
Why isn’t a matching row count enough to validate a migration?
A row count proves the rows arrived, not that their values survived. In DataKitchen’s Jaffle Shop test, a 55-test health-check suite passed with zero failures after 483 orders were dropped and a product name and description were trimmed. The 345-test Table Comparison suite caught both, with 61 failures, because it compares counts, lengths, sums and value hashes against the source.
What can’t TestGen’s table comparison detect?
Table Comparison is not a cell-by-cell, row-by-row diff, so it reports which tables and columns differ, not which rows. In DataKitchen’s testing on three public datasets it caught 774 of 785 planted changes. The misses were binary columns, type changes within the same general type, and values swapped across a composite key. The docs add two more: values swapped between rows of a table with no key column, and numeric changes that disappear when the value is rounded to six decimal places. It also can’t tell an intended change from a mistake.