Introduction: A Thousand Pipelines and No Way to Know
Jason is the Chief Data Officer for Company X, and he is responsible for six teams of data engineers, scientists, and analysts across three geographic locations. The breadth of his teams’ work and the technologies they use present a significant challenge to his main goal: to deliver new and useful analytics solutions to the business. The problem? He already has 1,000 data pipelines running with no way to know if they are working properly — or producing what is expected — with 10,000 users relying on the data insights they produce. And his teams are so overworked maintaining these systems and firefighting that they cannot deliver on the many new requests coming from the business.
Like Jason, you have a significant investment in your data and the infrastructure and tools your teams use to create value. Do you know for sure that it’s all working properly, or do you hope and pray that a source data change, code fix, or new integration won’t break things? If something does break, can you find and fix the problem quickly, or does your team spend days just diagnosing the issue? Do you fear that phone call or email from an angry customer who finds the problem before you do? How can you be confident that nothing will go wrong, and your customers will continue to trust your deliverables?
DataOps Observability can help you ensure that your complex data pipelines and processes are accurate and that they deliver what they were designed to do. Observability will also validate that your data science models, reports, and other parts of the data value chain are performing as expected. This solution sits on top of your existing infrastructure — without replacing staff or systems — to monitor your data operations. And it can alert you to problems before anyone else sees them.
DataOps Observability is a logical first step in implementing DataOps in your organization. It tackles the problems you are facing right now, and prepares you for a future of full DataOps automation.
Errors Happen; Do You React or Prevent?
Sure enough, Jason gets the call he’s been dreading. There will be a problem, customers will be angry, he’ll have to work late. But it’s worse than that! This call is from the CEO — his boss’s boss — and it’s only 7:30 a.m. He breaks into a sweat and answers the phone. Through the yelling, he learns that a compliance report, sent to the board, government regulators, and critical business partners, was empty! The pipeline process finished with no problems, on time. But no data. He makes promises, ends the call, and cancels the rest of his day. He gets 26 of his best and brightest engineers on a video call to begin troubleshooting. At 1:00 p.m., the ad hoc team has found the root cause: a change to a source file resulted in passing a blank field through the pipeline. At 2:45, they have a fix implemented on one engineer’s machine, but it will take six weeks to get that fix deployed to the production pipeline. At 3:00, he takes a deep breath and calls the CEO to break the news.
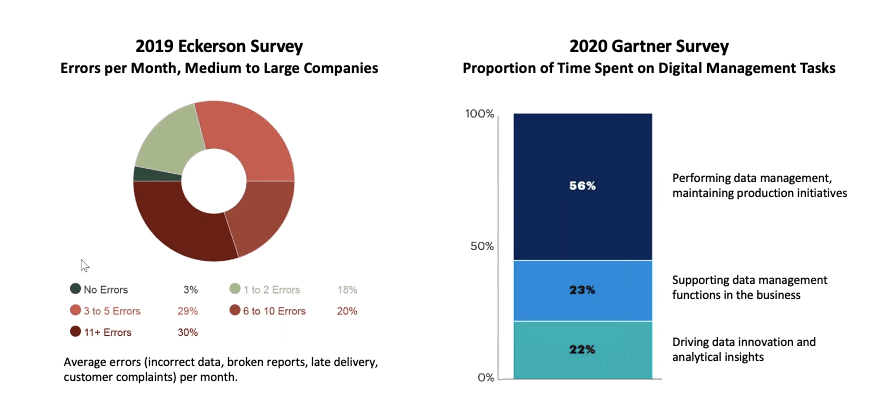
Sound familiar? When was the last time this happened to you? Today’s data and analytic systems are complex, made up of any number of disparate tools and data stores. Crisis happens, errors are inevitable, and they are not only a huge embarrassment but also can affect business performance. Jason’s experience is not a unique one. A 2019 DataKitchen/Eckerson survey found that 79% of companies have more than three data-related errors in their pipelines per month. A 2020 Gartner survey revealed that 56% of engineer time is spent on operational tasks and addressing errors, not on innovations and customer requests.
Many companies are stuck in a culture of “hope and pray” that their changes and integrations won’t break anything and a practice of “firefighting” when things inevitably go wrong. They wait for customers to find problems. They blindly trust their providers to deliver good data on time without changing data structures. They interrupt the daily work of their best minds to chase and fix a single error in a specific pipeline, all the while not knowing if any of the other thousands of pipelines are failing.
It’s a culture of productivity drains, which results in customers losing trust in the data.
Bad data reaches the customer because companies haven’t invested enough, or at all, in testing, automation, and monitoring. They have no way to catch errors early. And with engineers jumping around to put out the fires, their already demanding workloads are deprioritized. Customer delivery dates are missed, new features cannot be integrated, and innovations stop coming. As customer confidence in the data and analytics decreases, so does customer satisfaction.
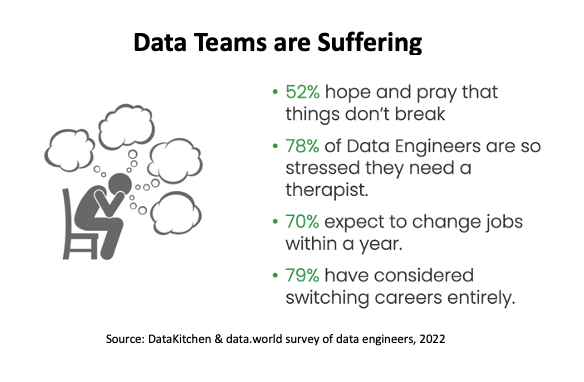
Another result is rampant frustration within data teams. A survey of data engineers conducted by DataKitchen in 2022 revealed some shocking statistics. Data engineers are the people building pipelines, as well as doing data processing and data production. And they are suffering: 78% feel they need to see a therapist, and a similar number have considered quitting or switching careers. The industry is experiencing a shortage of people who do data work due to a supply problem as well as the exodus of people leaving the field because it’s so stressful.
Why Haven’t They Solved It?
Jason follows the progress on the production fix very closely and updates the CEO at every stage. Naturally, the CEO wants to know why it takes so long to resolve the issue. “It’s just code; it’s what you guys do every day! Can’t you patch it or something?” When the fix is fully tested and deployed to the production pipeline, Jason has time to reflect. He’ll conduct a post mortem with his team on the specific issue, but he wants to find a solution to the bigger problem. Why has the company never addressed this kind of risk? What can he introduce into his data infrastructure and development cycle to ensure these things don’t happen again?
You’re just too busy. You’ll get to it next year… right? The situation is so bad, your team is stressed, and things are breaking left and right. So, why hasn’t your company — and many others — solved these problems? There are several reasons.
Teams are obviously very busy. They have backpacks full of customer requests, and they go to work every day knowing that they won’t and can’t meet customer expectations. The work that they are able to complete may sit for a while because any change to the complicated architecture or fragile pipeline may break something. When a change finally deploys, the teams have no way to see the whole landscape to ensure everything continues to run smoothly. Even if they could look at everything across their complex data operations, they don’t know what and where to check for dependencies, failures, and data inconsistencies.
Obstacles to fixing the problems in your data operations
| Obstacle | What it looks like |
|---|---|
| No time and resources | Teams are already busy and stressed and are not meeting customer expectations. |
| Low appetite for change | Teams have complicated in-place data architectures and tools, and they fear changes to what is already running. |
| No single pane of glass | Teams have no ability to see across all tools, pipelines, jobs, processes, datasets, and people. |
| No insight on testing | Teams don’t know what, where, and how to check operations to ensure that the outputs are right. |
| Lots of blame and shame | Teams are panicked when customers find problems and spend time, without a shared context, trying to find out who is responsible. |
And then there are the considerable numbers of teams and data inputs, transformations, models, and visualizations involved. When something goes wrong, there is a lot of finger pointing and blame to go around. Each team knows its small part of the landscape, but there is no shared context among them of the larger picture — its infrastructure and problem areas — to adequately and efficiently address the issues.
It’s a big risk if your teams can’t answer basic questions about production processes or if the answers are found in pockets of your organization with teams who have no way to communicate broadly. Do they know if the data is going to arrive on time? Do they know if integrations with other datasets are right? Without a single source of truth about what’s running, how can you pinpoint the failures? How can you find problems before your customers do?
Basic questions most teams cannot answer today
- Did the data management job finish successfully and on time?
- Is my output data correct?
- Are the dashboard, report, and dataset being used?
- What resources did the process consume?
- Did my source data arrive on time?
- Is my source data current, and is the data quality as expected?
- Did job X run after all the jobs in group A were completed?
- How many jobs ran yesterday, and how long did they take?
- How many jobs will run today, and how long will they take?
- Is there a pipeline with frequent or intermittent errors?
There’s a similar risk when teams do not understand the status of development processes and deployments to production. Do your teams know how many deployments are happening and how often? Do they know what pipeline processes and what environments are affected by a deployment? Do they know how many changes are going into production? Not knowing these answers makes it very hard to ensure that everything is going well and even harder to find problems when they occur.
The industry is replete with data tools, automation tools, and IT monitoring tools. But none of these tools fully addresses the problem. You have to monitor your entire data estate and all the reasons why pipelines may succeed or fail, not just server performance, load testing, and tool and transaction testing. A complete DataOps Observability solution is required.
Many tools; no end-to-end control. The same job is done by a different product in every cloud and every team, and none of them can see the others.
| Tool/component | Azure | AWS | GCP | Third party / others |
|---|---|---|---|---|
| ETL/orchestration | Data Factory | Glue, DataPipeline | DataFlow, Composer (Airflow) | Talend, Informatica, IBM DataStage |
| Big data ETL/orchestration | Databricks | Glue, Kinesis, EMR | PubSub, Composer (Airflow), Cloud DataFusion | Airflow, Streamsets, Fivetran |
| Data science | Python, TensorFlow, Databricks | Python, SageMaker | Python, AI Platform, TensorFlow | DataRobot, IBM Watson |
| DevOps | Azure DevOps | Code Deploy, Code Pipeline | CloudBuild | dbt, Delphix, Puppet |
| Version control | GitHub, Azure Repos (git) | CodeCommit (git) | Cloud Source Repositories (git) | GitHub, GitLab, Bitbucket |
| Secret store | Azure Key Vault | Secrets Manager | Google Secret Manager | HashiCorp |
| Storage | ADLS | S3 | GCS | IBM Cloud Object Storage |
| Databases | Cosmos, SQL Server, Synapse | Redshift, Aurora, DocumentDB | BigQuery, Postgres, Bigtable | Snowflake, Teradata, Vertica |
| Analytic tools | Power BI | QuickSight | Looker, DataLab, DataStudio | Qlik, Tableau, ThoughtSpot, Cognos |
| Infra automation | Terraform | Cloud Formation, Chef, Puppet | Terraform, Chef, Procurement Manager | Chef, Ansible |
| Data catalog | Azure Data Catalog | LakeFormation, Glue | Google Data Catalog | Collibra, Watson Catalog |
This is where DataOps Observability fills a gap in the industry.
DataOps Observability to the Rescue
Jason knows he needs to implement changes, but what and where? The more he reads about DataOps, the more he knows his company needs to make the transition. He thinks he can sell his boss and the CEO on this idea, but his pitch won’t go over well when they still have more than six major data errors every month. He wonders what it would take to create a dashboard that could monitor his pipelines and alert him to potential problems or track negative trends before he gets the next dreaded call.
When considering how organizations handle serious risk, you could look to NASA. The space agency created and still uses something called “mission control” with many screens sharing detailed data about all aspects of a space flight. That shared information is the basis for monitoring mission status, making decisions and changes, and then communicating to all people involved. It is the context for people to understand what’s going on in the moment and to review later for improvements and root cause analysis.
Any data operation, regardless of size, complexity, or degree of risk, can benefit from DataOps Observability. Its goal is to provide visibility of every journey that data takes from source to customer value across every tool, environment, data store, data and analytic team, and customer so that problems are detected, localized, and raised immediately.
IMPORTANT
The goal of DataOps Observability is to provide visibility of every journey that data takes from source to customer value across every tool, environment, data store, data and analytic team, and customer so that problems are detected, localized, and raised immediately.
DataOps Observability does this by monitoring and testing every step of every data and analytic pipeline in an organization, in development and production, so that teams can deliver insight to their customers with no errors and a high rate of innovation. It relies on a hierarchy of data journeys, or representations of actual pipelines, that observe and track the processes within the end-to-end value chain of the data.
Data journey observability is the first of two steps in implementing DataOps. It tackles the immediate challenges in your data operations by providing detailed information about what’s going on right now. You need to sort out the current state of your data enterprise before you focus on the iterative development, automation, and customer value goals of a full DataOps transformation.
DataOps Observability Starts with Data Journeys
Jason considers his dashboard idea but quickly realizes the complexity of building such a system. It’s not just a fear of change. It’s because it’s a hard thing to accomplish when there are so many teams, locales, data sources, pipelines, dependencies, data transformations, models, visualizations, tests, internal customers, and external customers. Too many moving parts, he thinks, but there has to be some way to prove things work before my customers see them!
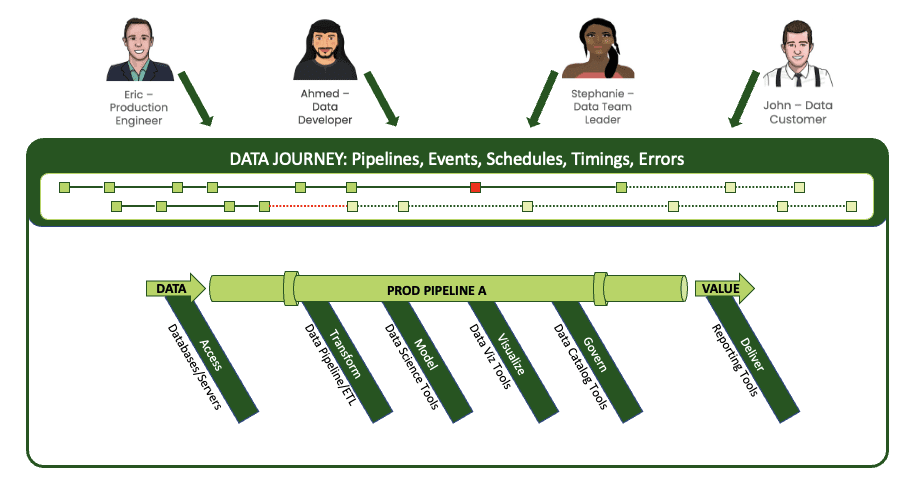
DataOps Observability works because it visualizes data journeys that span all of these moving parts, beginning with the people. Take four main constituents in your operations: production engineers, data developers, data team managers, and customers. They all have different roles and different relationships with the data. Data journeys give them all a shared context about data operations — what pipelines are running or will run, the status and quality of those pipelines, what development is in progress, and where it will be deployed.
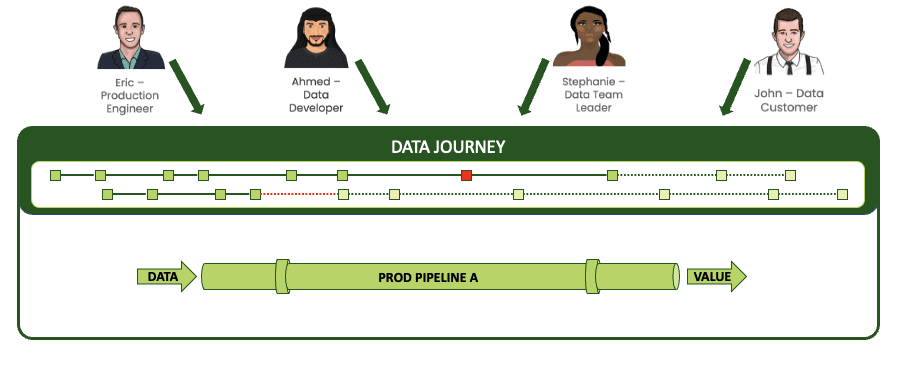
And when these stakeholders can see a shared view of a single pipeline, they know everything that’s happening during a run of that pipeline. The journey reveals all of the complex steps, toolchains, and actions within the data workflow — most importantly, where things go wrong.
For example, in a single pipeline you might have some FTP file sources that you ingest into S3 buckets. That data then fills several database tables. A Python model runs, and you deliver some Tableau extracts that publish to Tableau reports. Your “simple” pipeline involves a toolchain that features Fivetran, dbt, SQL, a Jupyter notebook, and Tableau. And to run everything, you use a wrapper like Airflow or a cron job or a manual procedure. With DataOps Observability, you can integrate the full context of all of these elements into a data journey that monitors the stack.
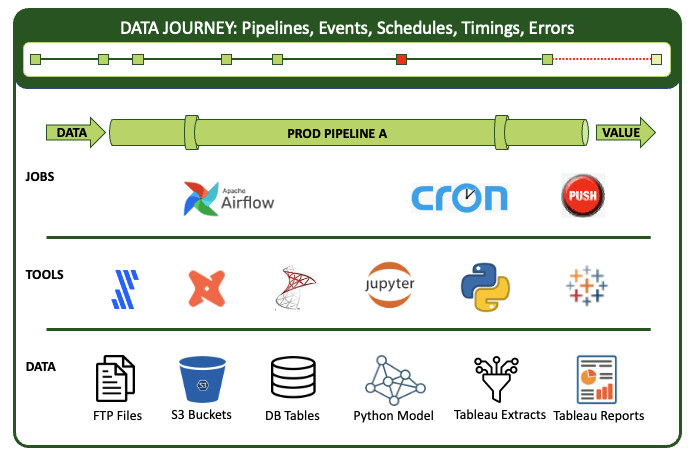
The journey tracks all levels of the stack from data to tools to code to tests across all critical dimensions. It supplies real-time statuses and alerts on start times, processing durations, test results, and infrastructure events, among other metrics. And if you’re armed with this information, you can know if everything ran on time and without errors and immediately identify the specific parts that didn’t.
As valuable as this visibility is to this single pipeline and its users, most organizations have large numbers of pipelines that need this level of observation.
A Journey Maps and Observes Everything
Jason realizes that he’s developed something similar before. In his role in Marketing as Customer Experience Manager, he built customer journey maps to track customer touchpoints with their brand and products. That effort guided improvements in their sales and marketing programs and produced a huge increase in customer engagement. So why can’t he do the same thing for the many journeys that his data takes from source to customer value?
DataOps Observability journeys are current and future representations of data stores, processes, pipelines, or groups of pipelines and their upstream and downstream dependencies.
Every data operation is a kind of factory, some with hundreds of pipelines, each made up of a combination of tools, technologies, and data stores. As a result, there are many tools — thousands of them — for databases, data transformation, data science modeling, data visualization, data catalogs, and more. And each tool has code that’s acting on the data in some way.
Even more challenging is the fact that these pipelines are anything but uniform. Some are batched, some are streaming, some are scheduled or triggered from a dependency, while some are entirely manual. And they all may have different deployment methods and environments. Further, the pipelines are owned and operated by very different teams in different divisions, departments, or groups within your company.
The good news is that a single data journey can span multiple, related pipelines to track all of the data and analytic infrastructure within them.
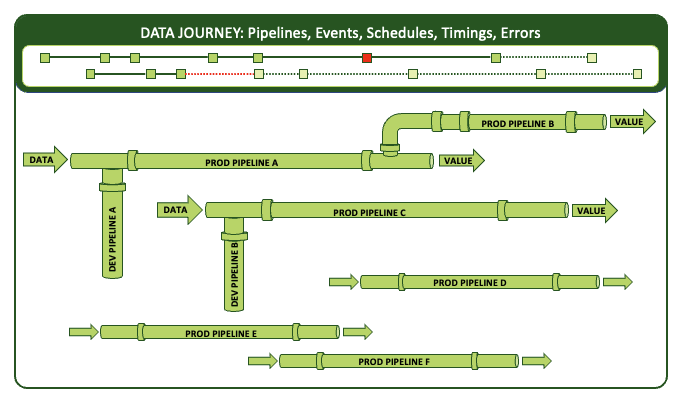
A data journey can “see” all of this because it is a meta-structure that goes beyond typical test automation, application performance monitoring, and IT infrastructure monitoring software. While quite valuable, these solutions all produce lagging indicators. With these tools you may know that you are approaching limits on disk space, but you can’t know if the data on that disk is correct. You may know that a particular process has completed but you can’t know if it completed on time or with the correct output. You can’t quality-control your data integrations or reports with only some of the details.
Since data errors happen with more frequency than resource failures, data journeys provide crucial additional context for pipeline jobs and tools and the products they produce. They observe and collect information, then synthesize it into coherent views, alerts, and analytics for people to predict, prevent, and react to problems.
No Journey Exists in a Vacuum
Jason takes a well-deserved break and meets up with his colleague Maria, Manager of Data Science, at the local coffee shop. He decides to run his data journey map idea by his friend. Maria listens carefully, nodding in agreement, then asks a question. “Will this help me know when my scientists are going to get new feeds of sales data from your engineers?” Jason frowns. What data feed? How did he not know about this downstream use?
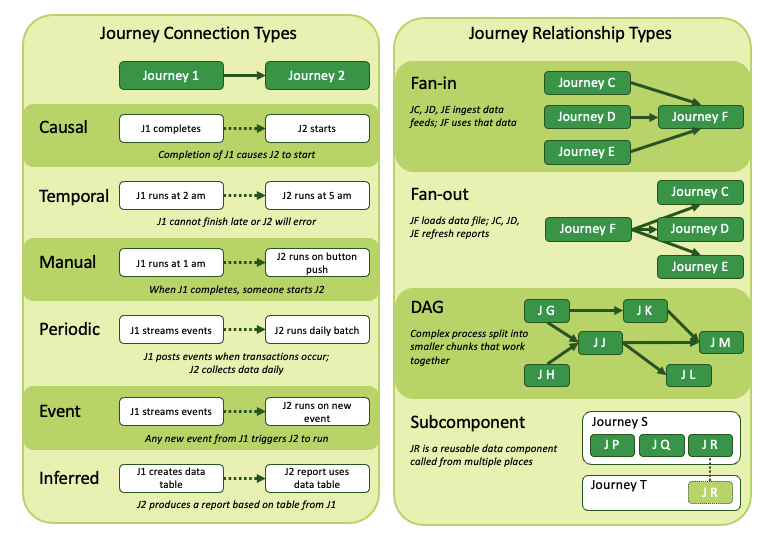
This lack of visibility is why data journeys track and collect information across all levels of your organization. Starting small, they simplify the complex steps within pipelines. You can define journeys to represent the process “chunks” you truly care about, ignoring the noise of more granular details. Then expanding their scope, journeys also represent and track complex relationships among all your pipelines where no connections are currently coded. To accomplish this, you can set up relationships among the journeys themselves.
Imagine being able to pull together contexts from across the organization where data is shared or processes are dependent on inputs and transformations.
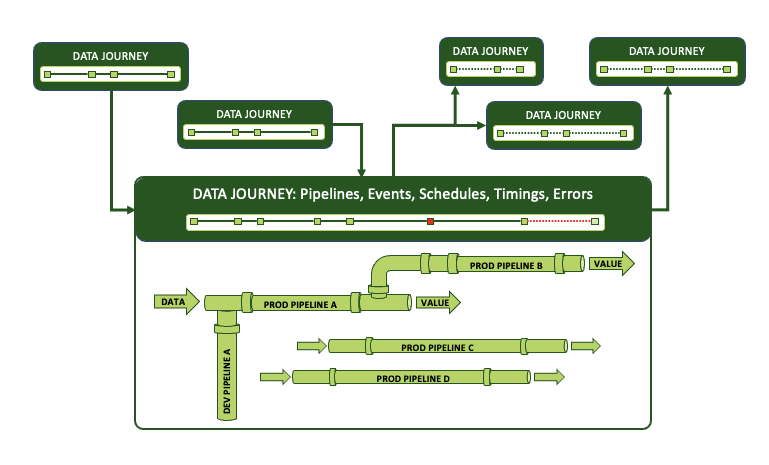
So often these relationships among data pipelines are tribal knowledge, rather than concrete and actionable connections. But when there’s a problem, you need to know how these relationships could amplify it.
By identifying how pipelines actually connect via data dependencies and relate through shared data use across your data estate, you can build relationships among the representational journeys to reflect them.
- Build in causal connections, where one pipeline starts after another completes.
- Build in temporal connections, where two pipelines are scheduled to run separately but have dependencies. If the first is late finishing there are problems.
- Build in event-driven connections where streaming pipelines get data and run based on specific events.
- Build in a fan-in relationship where those same event-driven pipelines finish at the end of the day, fill up some S3 buckets and build some tables in Snowflake. And then another process takes those tables and builds a star schema, producing some reports.
- Build in a sub-component relationship where you have a pipeline containing reusable sub-pipelines.
Constructing Effective Journeys
As he thinks through the various journeys that data take in his company, Jason sees that his dashboard idea would require extracting or testing for events along the way. So, the only way for a data journey to truly observe what’s actually happening is to get his tools and pipelines to auto-report events.
An effective DataOps observability solution requires supporting infrastructure for the journeys to observe and report what’s happening across your data estate. Observability includes the following components.
- Functionality to set pipeline expectations
- Logs and storage for problem diagnosis and visualization of historical trends
- An event or rules engine
- Alerting paths
- Methods for technology/tool integrations
- Data and tool tests
- An interface for both business and technical users
Setting Expectations
In addition to the tracking of relationships and quality metrics, DataOps Observability journeys allow users to establish baselines — concrete expectations for run schedules, run durations, data quality, and upstream and downstream dependencies. Observability users are then able to see and measure the variance between expectations and reality during and after each run. This aspect of data journeys gives users real-time information about what is happening now or later today, and if data delivery will be on time or late. It can feed a report or dashboard that lists all datasets and when they arrived, as well as the workflows and builds that are running.
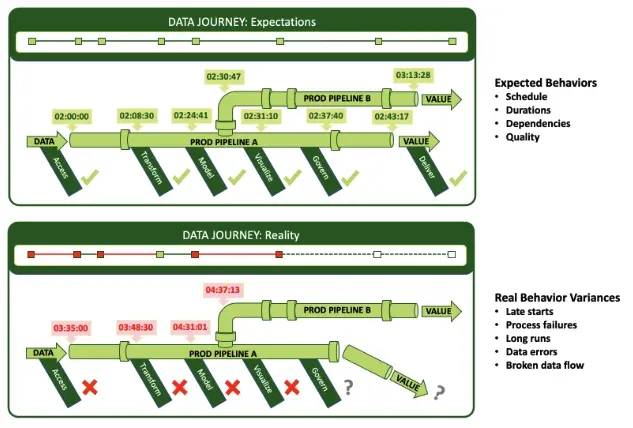
With this information in a shared context, your analyst working on a data lake will know if the 15 datasets she is viewing are accurate, the most recent, or of the same date range. And she’ll know when newer data will arrive. She can work more efficiently knowing when to conduct her analyses and what delivery date to communicate to her customers.
Storing Run Data for Analysis
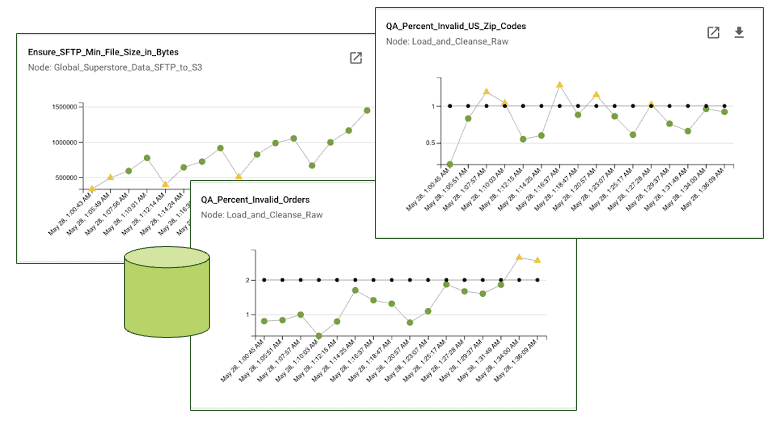
Real-time details are not the only purpose for setting and measuring against expectations. DataOps Observability must also provide a store of run data over time for root cause diagnosis and statistical process control analysis. It’s not just about what is happening during the operation; it’s also about what happens after the operation. By storing run data over time, Observability allows your analysts to look at variances from an historic perspective and make adjustments. Finding trends and patterns can help your team optimize your data pipelines and even predict and prevent future problems.
Identifying Events and Actions
So DataOps Observability captures all this information and stores it in a database, but that ends up being a lot of data that someone has to monitor and sift through. Fortunately, Observability includes an event engine that can react to what’s happening in the journeys and cut down the signal-to-noise ratio. Given a set of rules, the event engine can trigger notifications through email or to Slack and other services, send alerts to your operations people, issue commands to start or end pipeline runs, and prompt other actions when the difference between expected results and actual runs exceeds your thresholds of tolerance.
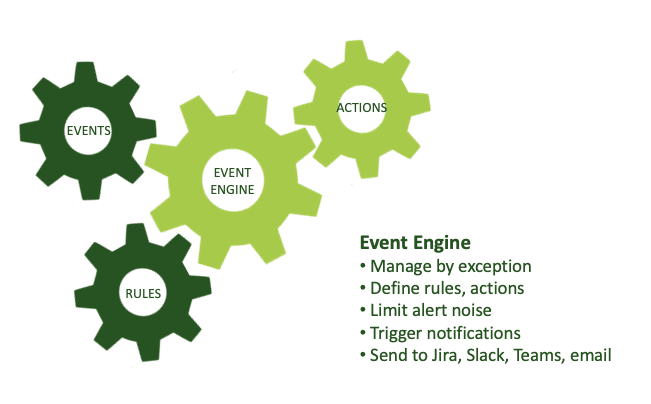
With this actionable data combined with an understanding of the bigger context of your data estate, you can empower your employees to stop production pipelines before problems escalate.
Alerting on All Critical Dimensions
While alerts on run schedules, durations, dependencies, and data tests are valuable, these metrics alone do not tell the whole story of every data journey. After all, pipelines execute on infrastructure, and that infrastructure has to be managed. To that end, DataOps Observability must also accept logs and events from IT monitoring solutions like DataDog, Splunk, Azure Monitor, and others. Observability can consolidate the information into critical alerts on the health of data pipelines, providing clear visibility into the state of your operations.
Integrating Your Tools
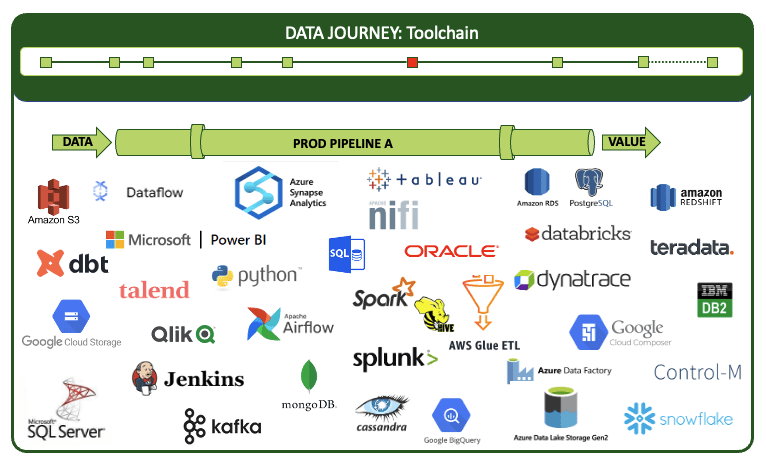
DataOps Observability has to support any number and combination of tools because your toolchain is potentially monumental and complex. With an OpenAPI specification, DataOps Observability can offer easy connections. Even better, pre-built integrations with your favorite tools make it simple to start transmitting events to and receiving commands from Observability right away.
Testing at Every Step
You want to track more than the schedule and duration of your runs. You want to check that the contents of your pipelines — the data, the models, the integrations, the reports, the outputs that your customers see — are as accurate, complete, and up to date as expected. You want to find errors early. To do that, your journeys need to include automated tests.
Tests that evaluate your data and its artifacts work by checking things like data inputs, transformation results, model predictions, and report consistency. They run the gamut from typical software development tests (unit, functional, regression tests, etc.) to custom data tests (location balance, historical balance, data conformity, data consistency, business logic tests, and statistical process control). Read more about DataOps testing in A Guide to DataOps Tests or Add DataOps Tests for Error-Free Analytics.
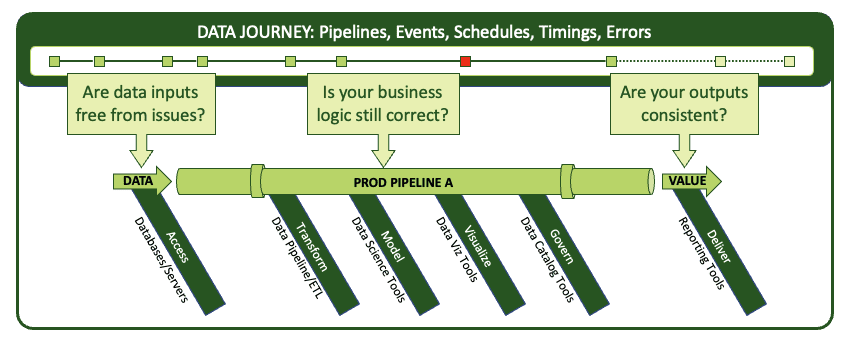
Your organization already has many sources of tests, which can transmit vital information to data journeys with rules for taking action. You may have a database that has its own test framework, your data engineers may have written some SQL tests, your data scientists may have written Python tests, you may have test engineers writing Selenium test suites, you may be using DataKitchen DataOps Automation for testing. All usable information.
Packaging It in a Friendly, Flexible UI
Finally, DataOps Observability must make it easy for multiple types of constituents to monitor what affects their jobs. Your production engineer needs to check on operations. Your data developers need to verify that the changes they make are working. Your data team manager needs to measure her team’s progress. Your business customer needs to know when the analytics will be available for his projects. They all require different views of the same data.
DataOps Observability has to provide interface views based on differing roles. The greatest benefit of the Observability UI is that it can reveal the breadth of a data estate with the elements and relationships that are vital to any given stakeholder. And, at the same time, it offers a way to plumb the depths of the complex layers of any pipeline to locate problems. It serves as a springboard for investigating and fixing issues with insight as to where those issues may reverberate across the enterprise.
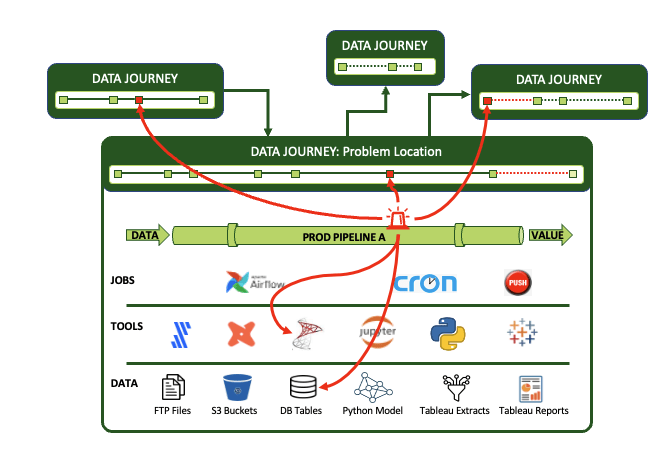
Together, the journeys, the expectations, the data store, the event engine, the rules and alerts, the integrated tools, the tests, and a robust interface enable complete observability. All of these elements come together to inform you of where the problems are, minimize the risk to customer value, provide a shared context for all constituents to know what’s happening and what’s going to happen, and alert the right people when something goes wrong.
DataOps Observability Benefits Summary
Jason determined that he could afford to form a small team and implement DataKitchen DataOps Observability. The team built a data journey and monitored a subset of pipelines as a proof of concept. When he presented some initial data to a group of stakeholders, his audience was surprised at the error rates revealed, given that only the big, customer-facing errors garnered all of their attention to date. Happily, Jason showed them how DataOps Observability could monitor, alert him to problems, prompt early fixes of these issues, and ultimately prevent many of these errors.
DataOps Observability is your mission control for every journey from data source to customer value, from any development environment into production, across every tool, every team, every environment, and every customer so that problems are detected, localized, and understood immediately.
In a world of complexity, failure, and frustration, data and analytics teams need to deliver insight to their customers with no errors and a high rate of change. As in Jason’s experience, the stress and embarrassment of breaking things crowd out the ability to create new insights. In a 2021 survey of 600 data professionals, responses suggested an overwhelming majority are calling for relief. In the survey, 97% reported experiencing burnout, 91% reported frequent requests for analytics with unrealistic or unreasonable expectations, and 87% reported getting blamed when things go wrong.
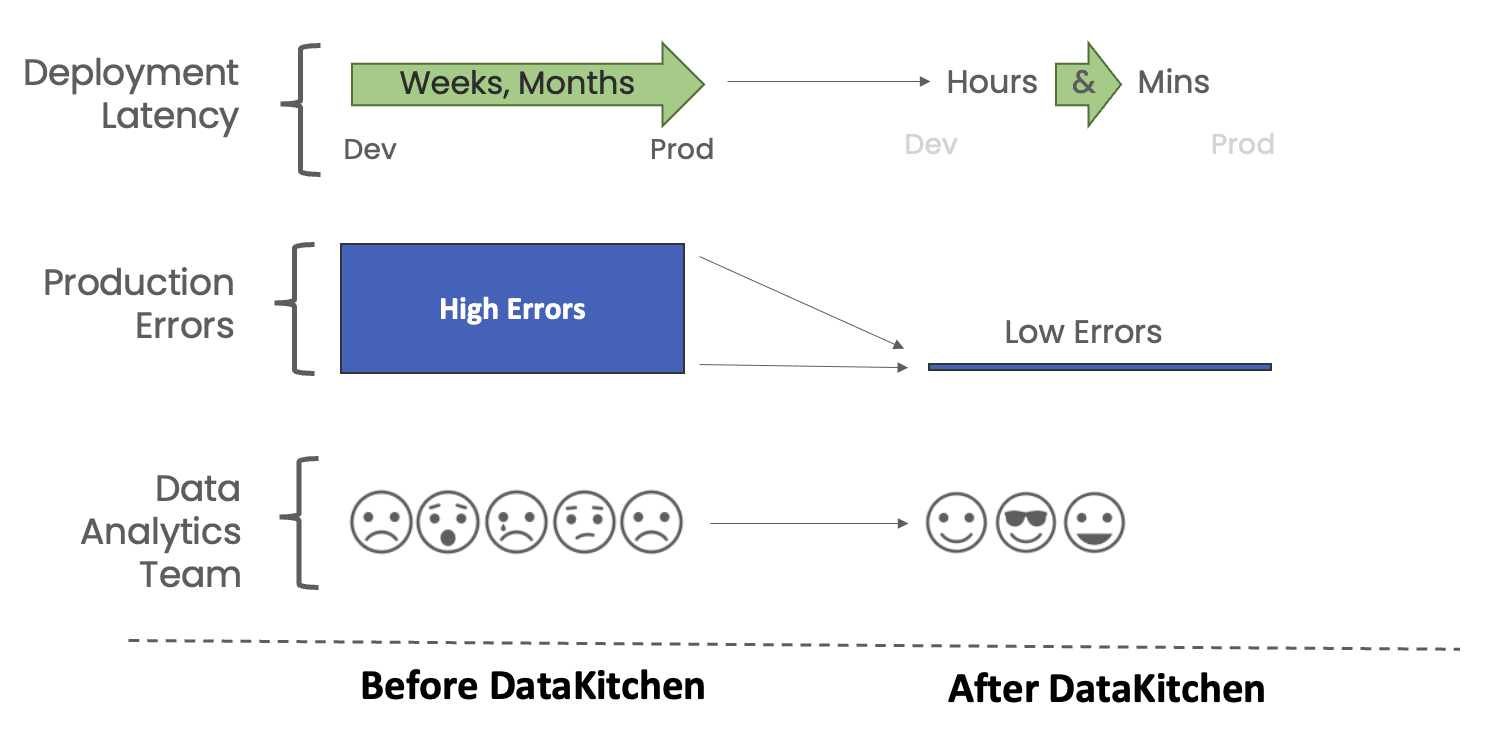
You don’t have to live with these problems. DataOps Observability provides critical features and benefits.
- Data journeys allow monitoring of every data process from source to customer value.
- Production expectations including data and tool testing reduce embarrassing errors to zero.
- Development data and tool testing increase the delivery rate and lower the risk of deploying new analytic insights.
- Historical dashboards enable you to find the root causes of issues.
- An intuitive, role-based user interface allows stakeholders — IT engineers, managers, data engineers, data scientists, analysts, and your business customers — to be on the same page.
- Simple connections and an open API enable fast integrations without replacing your existing tools.
When you reach for the stars of rapid, trusted customer insight, you need to start by reducing your team’s hassles and embarrassment while increasing the time it has to develop and deliver. By monitoring all data journeys, you can lower your error rates and achieve your goals. Do not replace your tools or infrastructure; use the DataKitchen DataOps Observability product on top of those tools. When you find a problem, use the DataKitchen DataOps Automation product to fix it permanently by automating the testing, deployment, and orchestration of all your chosen technologies.
Spend less time worrying about what may go wrong and gain more time to create by observing the entire data journey and taking early action to stay on track.
Related Reading
- What Is DataOps Process Observability? — the definition and scope this paper builds on
- Introducing the Five Pillars of Data Journeys — what a journey actually observes
- Taming the Chaos, Part 1: Defining the Problems — this paper as a four-part series
- Taming the Chaos, Part 2: Introducing Data Journeys
- Taming the Chaos, Part 3: Considering the Elements of Data Journeys
- Taming the Chaos, Part 4: Reviewing the Benefits
- “You Complete Me,” Said Data Lineage to Data Journeys — why lineage alone doesn’t tell you what ran
- Data Quality: The DataOps Way — the testing half of the story
- 7 Steps to Implement DataOps — the engineering practices underneath
- 2021 Data Engineering Survey — the burnout numbers quoted here, in full
FAQ
What is the main point of this paper?
Complex data operations fail silently, and no amount of firefighting fixes that. DataOps Observability provides visibility of every journey data takes from source to customer value — across every tool, environment, data store, team, and customer — so problems are detected, localized, and raised immediately. It sits on top of the tools you already run, and it is the logical first step in adopting DataOps.
What is DataOps Observability?
DataOps Observability is a methodology and a solution that monitors and tests every step of every data and analytic pipeline in an organization, in development and in production. It provides visibility of every journey data takes from source to customer value so problems are detected, localized, and raised immediately. It sits on top of existing infrastructure without replacing staff or systems.
What is a data journey?
A data journey is a representation of an actual pipeline, a data store, a process, or a group of related pipelines together with their upstream and downstream dependencies. It tracks every level of the stack — data, tools, code, and tests — and supplies real-time status and alerts on start times, processing durations, test results, and infrastructure events.
How is DataOps Observability different from IT monitoring or APM?
Test automation, application performance monitoring, and IT infrastructure monitoring all produce lagging indicators about infrastructure. They can tell you a disk is nearly full or that a process finished; they cannot tell you whether the data on that disk is correct or whether the process finished on time with the right output. Data errors happen more often than resource failures, so journeys add the missing context.
What components does a DataOps Observability solution need?
Seven: functionality to set pipeline expectations; logs and storage for problem diagnosis and historical trends; an event or rules engine; alerting paths; methods for technology and tool integrations; data and tool tests; and an interface serving both business and technical users. Together these turn collected events into decisions the right person can act on.
What are expectations in a data journey?
Expectations are concrete baselines for run schedules, run durations, data quality, and upstream and downstream dependencies. Once set, users can see and measure the variance between expectation and reality during and after each run. That variance is what tells an analyst whether today’s data will arrive on time, and what tells an engineer which step of which pipeline broke.
Why does storing run data over time matter?
Real-time status answers what is happening now; a store of run data answers what has been happening. Historical run data supports root cause diagnosis and statistical process control, letting analysts examine variances from a historical perspective, find trends and patterns, optimize pipelines, and predict and prevent problems before they recur.
What does the event engine do?
The event engine reacts to what happens in the journeys and cuts down the signal-to-noise ratio. Given a set of rules, it triggers notifications through email, Slack, and other services, sends alerts to operations staff, issues commands to start or end pipeline runs, and prompts other actions when the difference between expected and actual results exceeds a tolerance threshold.
How do journeys represent relationships between pipelines?
Relationships are built among journeys themselves, capturing dependencies no code records. Causal connections start one pipeline after another completes. Temporal connections cover pipelines scheduled separately but dependent on each other. Event-driven connections cover streaming. Fan-in gathers several pipelines into one downstream process, and sub-component relationships cover reusable sub-pipelines.
Why is observability the first step in implementing DataOps rather than automation?
Because you need to know the current state of a data estate before you can improve it. Data journey observability tackles the immediate problems by providing detailed information about what is running right now, which then makes the iterative development, automation, and customer value goals of a full DataOps transformation achievable rather than aspirational.
What are the main benefits of DataOps Observability?
Data journeys monitor every data process from source to customer value. Production expectations plus data and tool testing drive embarrassing errors toward zero. Development testing raises delivery rate and lowers deployment risk. Historical dashboards locate root causes. A role-based interface puts engineers, managers, analysts, and business customers on the same page, and an open API integrates existing tools rather than replacing them.
Get the PDF
The full paper is on this page. Fill in the form for a PDF copy to keep or share.