
Testing Is the Foundation of Observability
If there’s an error in data or analytics, the manager in charge is on the hook to report what, when and why the problem occurred and how to ensure that the same situation will not recur. Observability reflects the ease with which the data analytics team can get these answers. An observable system is architected with transparency and instrumentation, providing a complete picture of the data pipelines. In DataOps, tests provide status at each stage of processing. Testing is the foundation of observability. Most discussions of observability focus on data observability. DataOps testing covers observability of data, but also adds another dimension — process observability. DataOps provides fine-grained observability into what is happening with end-to-end analytics lifecycle workflows. DataOps testing provides the process transparency that enables a high level of observability.
In data analytics, data changes continuously as it flows through the system. Data can drift out of statistical range, defy data prep algorithms, and confuse machine learning models. While DevOps testing focuses on verifying code, DataOps testing must cover both analytics code and data.
Manual testing of code and data is performed step-by-step by a person. This process tends to be expensive as it requires a precious resource, such as a data scientist, to run tests one at a time. Manual testing can also be prone to human error and is often too cumbersome to run frequently.
DataOps automates testing, so test scripts execute under automated orchestration. Automated testing is much more cost-effective and reliable than manual testing, but the effectiveness of automated testing depends on the quality and breadth of the tests. In a DataOps enterprise, members of the analytics team spend 20% of their time writing tests. Whenever a problem occurs, a new test is added. New tests accompany every analytics update. The breadth and depth of the test suite continuously grow. One advantage of automated testing is that it’s easier to run, so it executes repeatedly and regularly.
To ensure high quality, you have to consistently and regularly test your data and code. Some people write a few unit tests and proudly call it “DataOps.” Unit tests are a move in the right direction, but there are several other types of tests that can improve the robustness of your data pipelines. A data organization can reduce the number of errors to virtually zero by implementing a breadth of tests at every step in their data analytics pipelines.
DataKitchen DataOps Automation executes tests as an intrinsic part of production orchestration and analytics continuous integration and deployment. Below are some standard production (data) and deployment (analytics) tests that should be part of every DataOps implementation. Most tests can be applied to both development and production.
Monitoring Data in Production
Think of data analytics as a manufacturing pipeline. There are inputs (data sources), processes (transformations), and outputs (analytics). A typical manufacturing process includes tests at every step in the pipeline that attempt to identify problems as early as possible. As every manufacturer knows, it is much more efficient and less expensive to catch a problem in incoming inspection as opposed to finished goods.
Figure 1 depicts the data analytics pipeline. In this diagram, analytics access databases and then transform data in preparation for being input into models. Models output visualizations and reports that provide critical information to users.
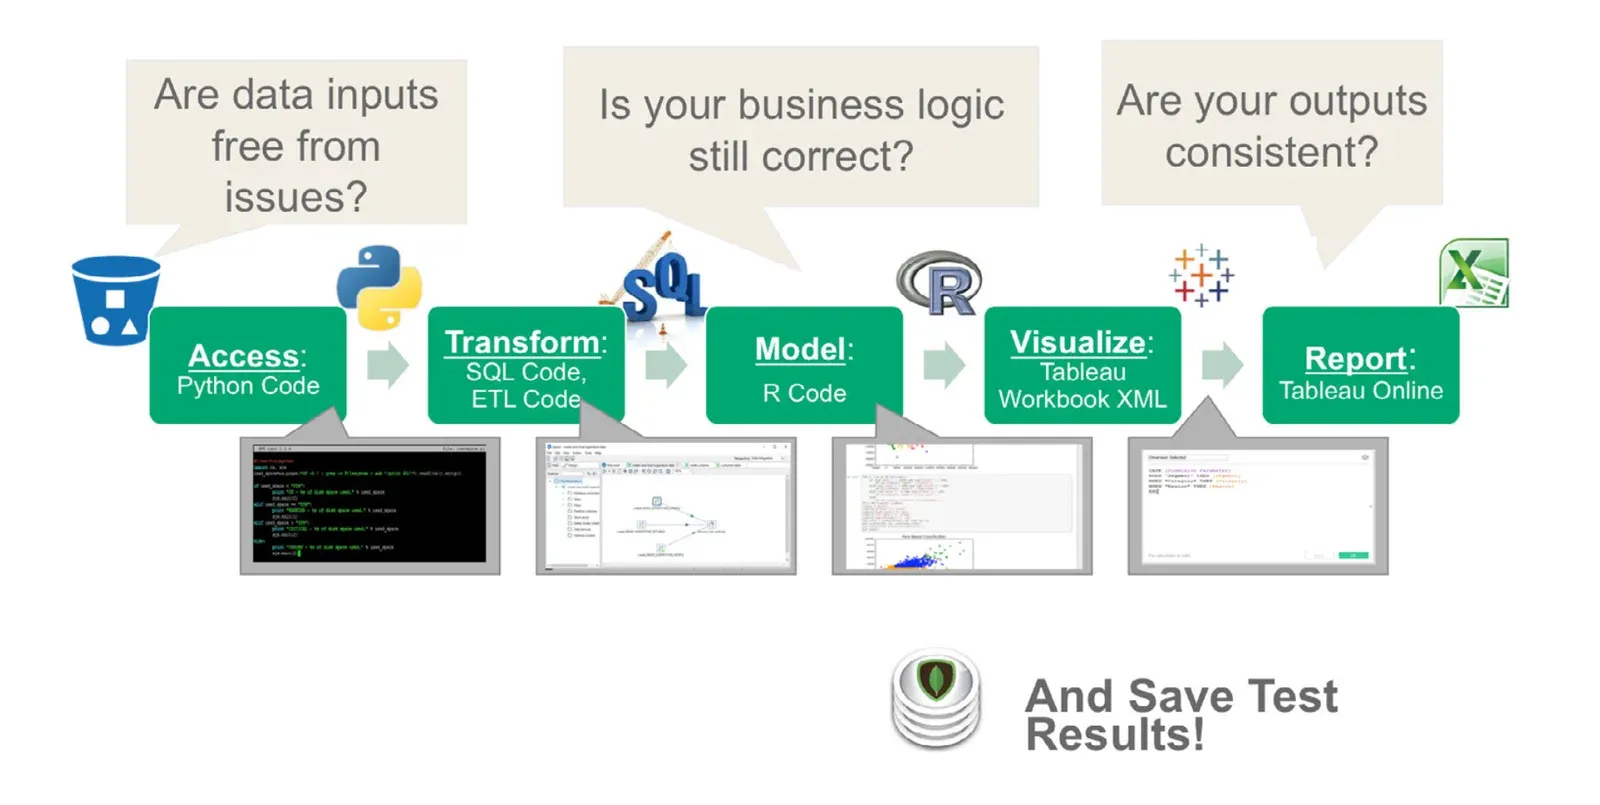
Along the way, tests ask important questions. Are data inputs free from issues? Is business logic correct? Are outputs consistent? As in lean manufacturing, tests verify every step in the pipeline. For example, data input tests are analogous to manufacturing incoming quality control. The table below shows examples of data input, output, and business logic tests.
Data input tests strive to prevent any erroneous data from being fed into subsequent pipeline stages. Allowing bad data to progress through the pipeline wastes processing resources and increases the risk of never catching an issue. Input tests also focus attention on the quality of data sources, which must be actively managed — industrial manufacturers call this supply chain management.
Data output tests verify that a pipeline stage executed correctly. Business logic tests validate data against tried and true assumptions about the business. For example, perhaps all European customers are assigned to a member of the Europe sales team. Test results saved over time provide a way to check and monitor quality versus historical levels.
Tests validate data inputs and outputs, and verify that data is consistent with business logic
| Test category | What it checks | Examples |
|---|---|---|
| Inputs | Verifying the inputs to an analytics processing stage | Count Verification — check that row counts are in the right range. Conformity — US Zip5 codes are five digits, US phone numbers are 10 digits. History — the number of prospects always increases. Balance — week over week, sales should not vary by more than 10%. Temporal Consistency — transaction dates are in the past, end dates are later than start dates. Application Consistency — body temperature is within a range around 98.6F/37C. Field Validation — all required fields are present and correctly entered. |
| Business Logic | Checking that the data matches business assumptions | Customer Validation — each customer should exist in a dimension table. Data Validation — 90 percent of data should match entries in a dimension table. |
| Output | Checking the result of an operation, for example, a cross-product join | Completeness — the number of customer prospects should increase with time. Range Verification — the number of physicians in the US is less than 1.5 million. |
Types of Data Pipeline Tests
The data team may sometimes feel that its work product is under a microscope. If the analytics look “off,” users can often tell immediately. Business users are experts in their own domain and will often see problems in analytics with only a quick glance. It’s generally an unpleasant experience for the data team to learn about analytics errors from its internal and external customers.
Finding issues before your internal customers do is critically important for the data team. Three basic tests will help you find problems before anyone else: location balance, historical balance, and statistical process control.
Location Balance Tests
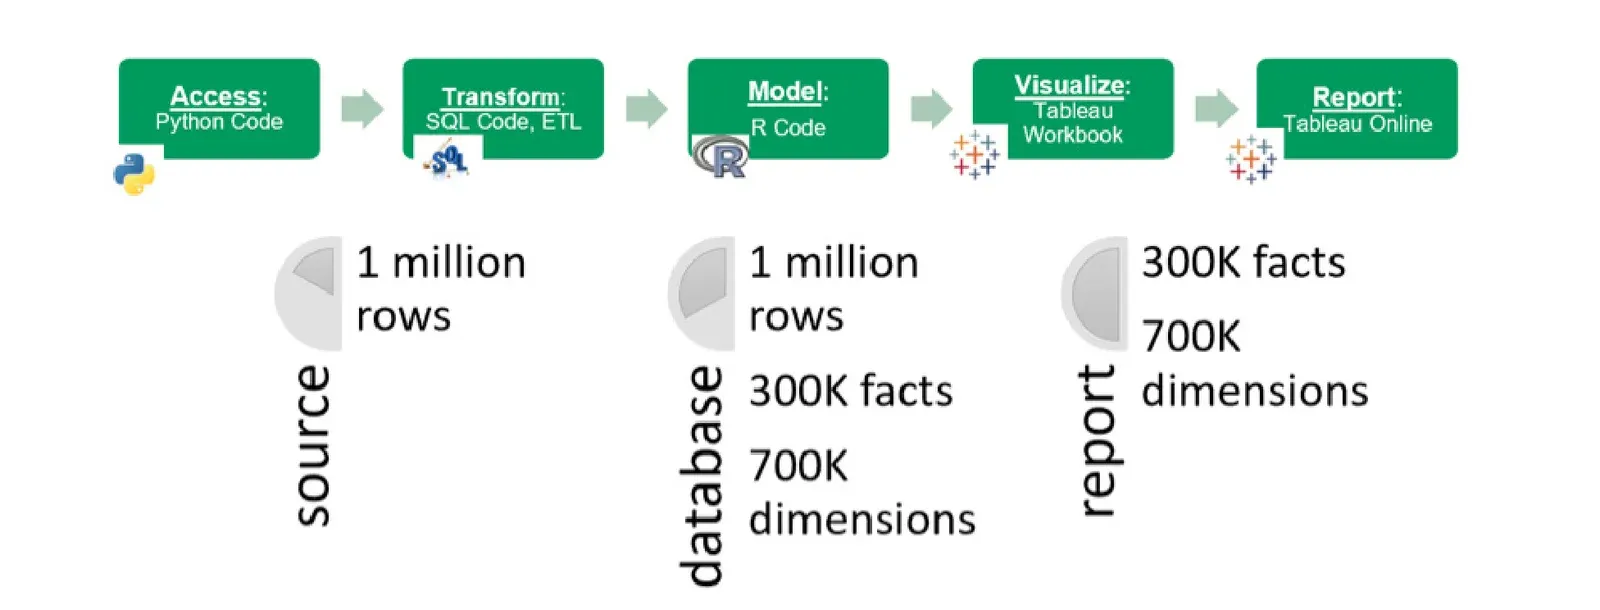
Location Balance tests ensure that data properties match business logic at each stage of processing. For example, an application may expect 1 million rows of data to arrive via FTP. The Location Balance test could verify that the correct quantity of data arrived initially and that the same quantity is present in the database, in other stages of the pipeline, and finally, in reports (Figure 3).
Historical Balance
Historical Balance tests compare current data to previous or expected values. These tests rely upon historical values as a reference to determine whether data values are reasonable (or within the range of reasonable). For example, a test can check the top fifty customers or suppliers. Did their values unexpectedly or unreasonably go up or down relative to historical values?
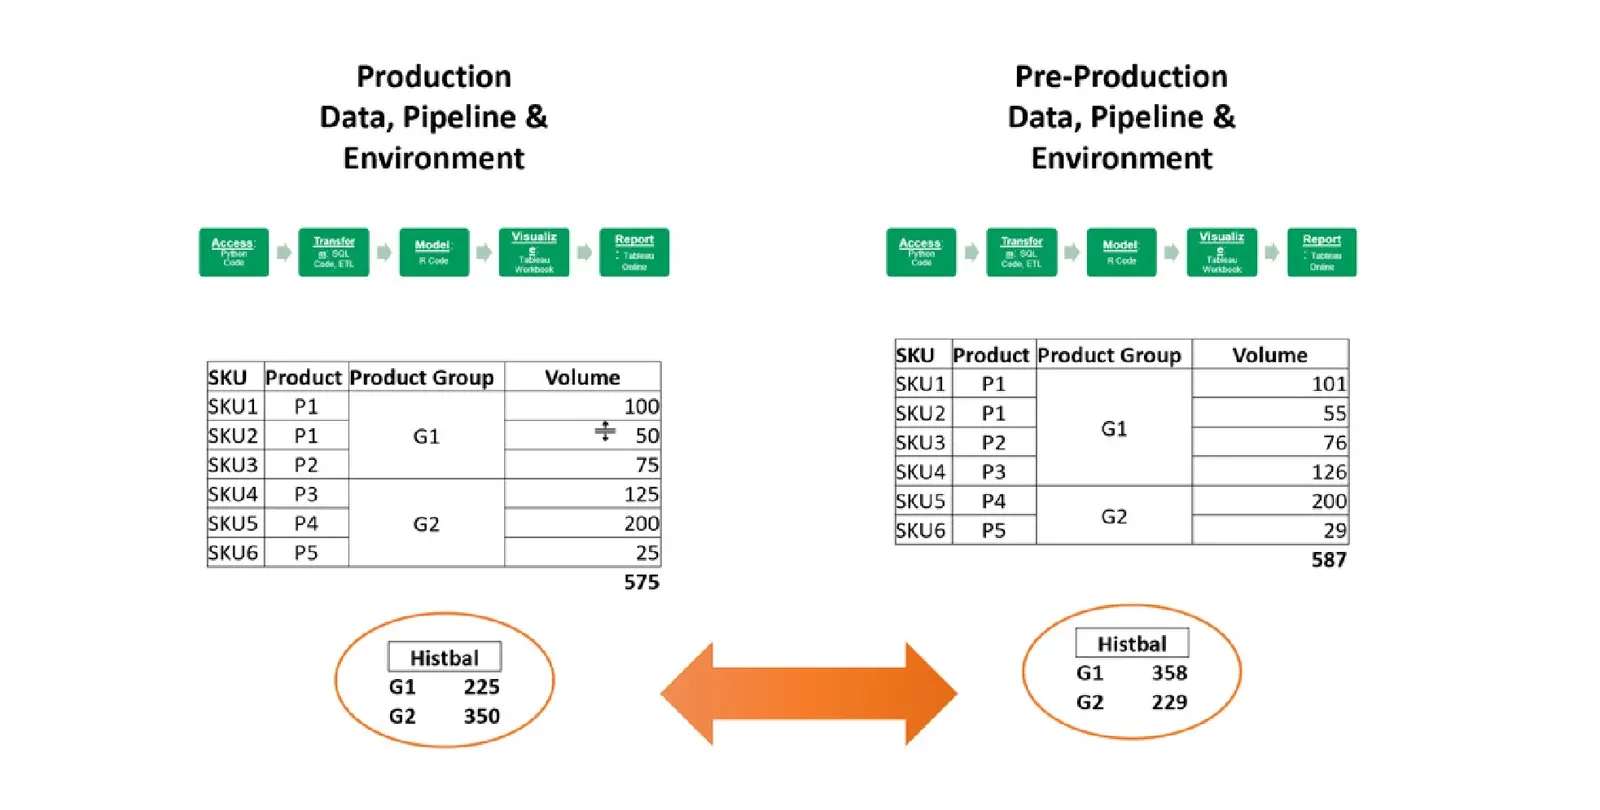
It’s not enough for analytics to be correct. Accurate analytics that “look wrong” to users raise credibility questions. Figure 4 shows how a change in SKU allocations, moving from pre-production to production, affects the sales volumes for product groups G1 and G2. You can bet that the VP of sales will notice this change immediately and report back that the analytics look wrong. Missing expectations is a common issue for analytics — the report is correct, but it reflects poorly on the data team because it seems wrong to users. What has changed? When confronted, the data analytics team has no ready explanation. Guess who is in the hot seat.
Historical Balance tests could have alerted the data team ahead of time that product group sales volumes had shifted unexpectedly. This warning would have given the data analytics team a chance to investigate and communicate the change to users in advance. Instead of hurting credibility, this episode could help build it by showing users that the reporting is under control and that the data team is on top of changes that affect analytics. “Dear sales department, you may notice a change in the sales volumes for G1 and G2. This difference reflects a reassignment of SKUs within the product groups.”
Statistical Process Control
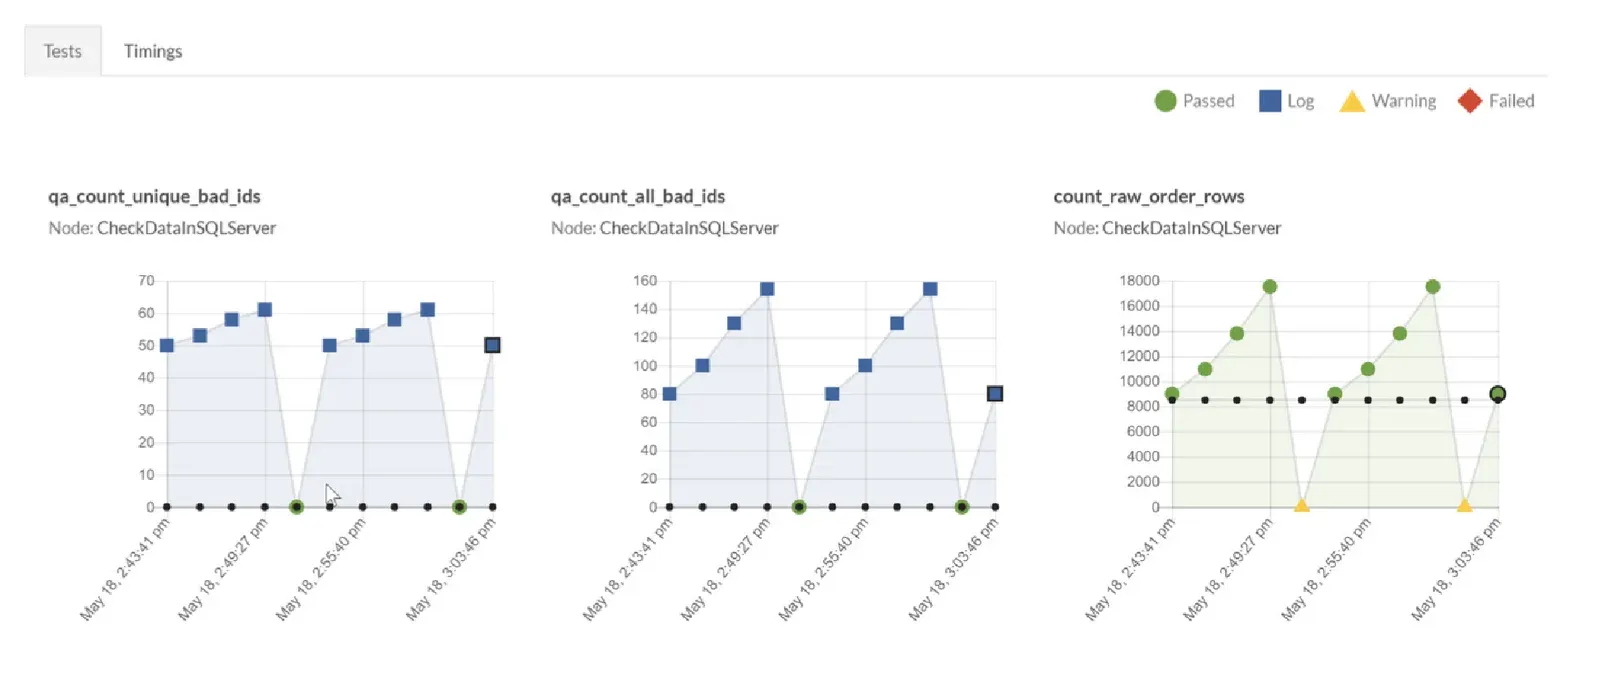
Lean manufacturing operations measure and monitor every aspect of their process in order to detect issues as early as possible. These are called Time Balance tests or, more commonly, statistical process control (SPC). SPC tests repeatedly measure an aspect of the data pipeline screening for error or warning patterns (Figure 5). SPC offers a critical tool for the data team to catch failures before users see them in reports.
Failure Modes
A disciplined data production process classifies failures according to severity level. Some errors are fatal and require the data analytics pipeline to be stopped. In a manufacturing setting, the most severe errors “stop the line.”
Some test failures are warnings. They require further investigation by a member of the data analytics team. Was there a change in a data source? Or a redefinition that affects how data is reported? A warning gives the data analytics team time to review the changes, talk to domain experts, and find the root cause of the anomaly.
Many test outputs will be informational. They help the data engineer, who oversees the pipeline, monitor routine pipeline activity or investigate failures.
Actions required for different failure modes
| Severity | Required action |
|---|---|
| Error | Stop the pipeline |
| Warning | Investigate the failure |
| Informational | Context-dependent |
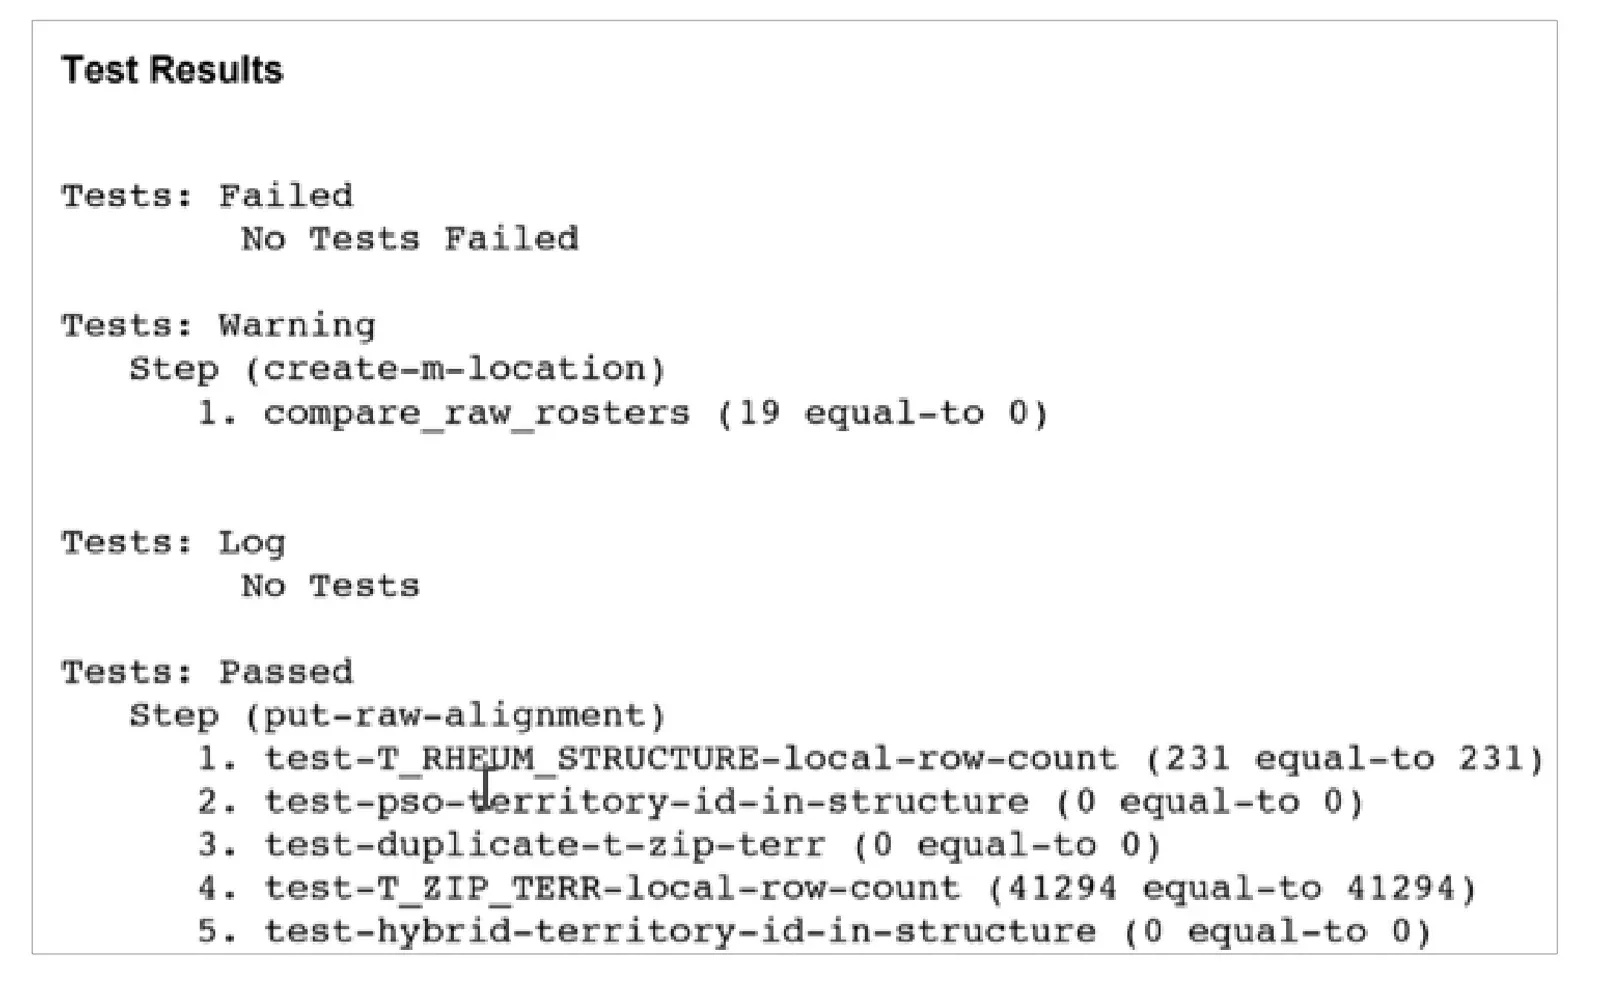
A complex process could have thousands of tests running continuously. When an error or warning occurs, a person on the data team should be alerted in real-time through email (Figure 6), text, or a notification service like Slack. Automated alerts free the data team from the distraction of having to poll test results periodically. If and when an event takes place, they’ll be notified and can take action.
TIP
Install Open Source DataOps TestGen to generate this class of production data test automatically from a profile of your tables, instead of hand-coding each one.
Testing Code in Development
At this point, some of you are thinking software development methods have nothing to do with me. I am a data analyst/scientist, not a coder. I am a tool expert. What I do is just a sophisticated form of configuration. This is a common point of view in data analytics. However, it leads to a mindset that slows down analytics cycle time.
Tools vendors have a business interest in perpetuating the myth that if you stay within the well-defined boundaries of their tool, you are protected from the complexity of software development. This view is ill-considered.
Don’t get us wrong. We love tools, but don’t buy into this falsehood.
The $100B analytics market divides into two segments: tools that create code and tools that run code. The point is — data analytics is code. The data professional creates code and must own, embrace and manage the complexity that comes along with it.
Returning to Figure 1 above, we see a data operations pipeline with code at every stage of the pipeline. Python, SQL, R — these are all code. The tools of the trade (Informatica, Tableau, Excel, …) are also code. If you open an Informatica or Tableau file, it’s XML. It contains conditional branches (if-then-else constructs), loops and you can even embed Python or R.
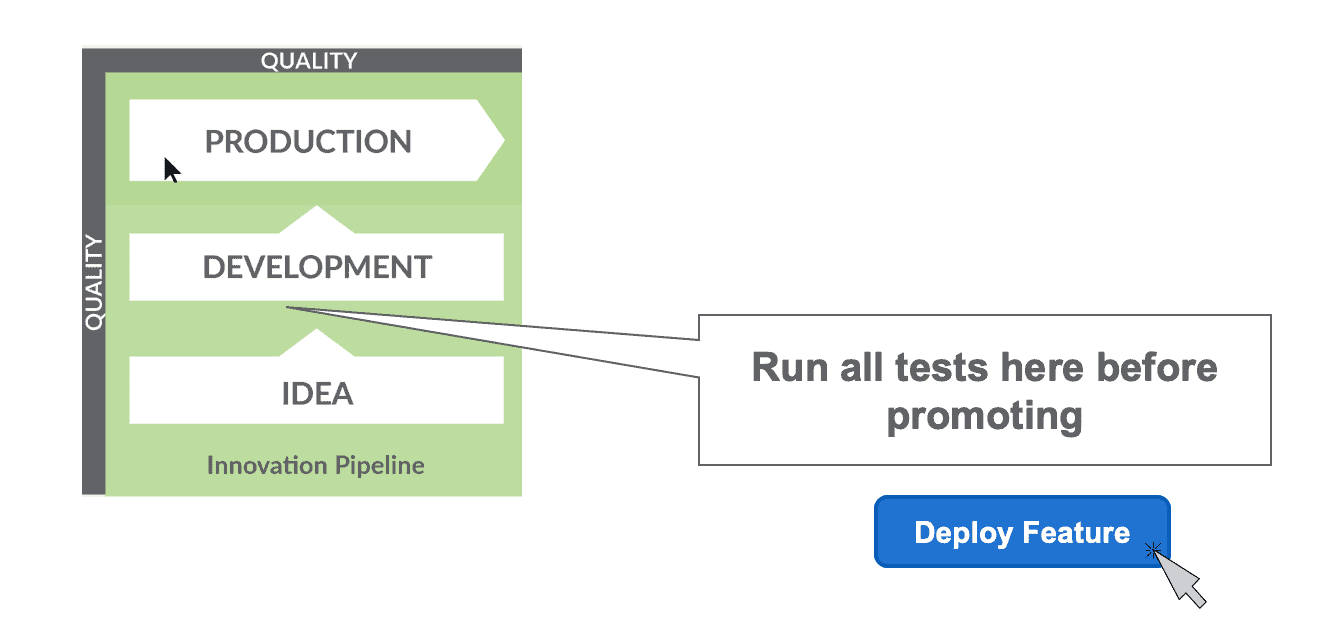
Types of Tests
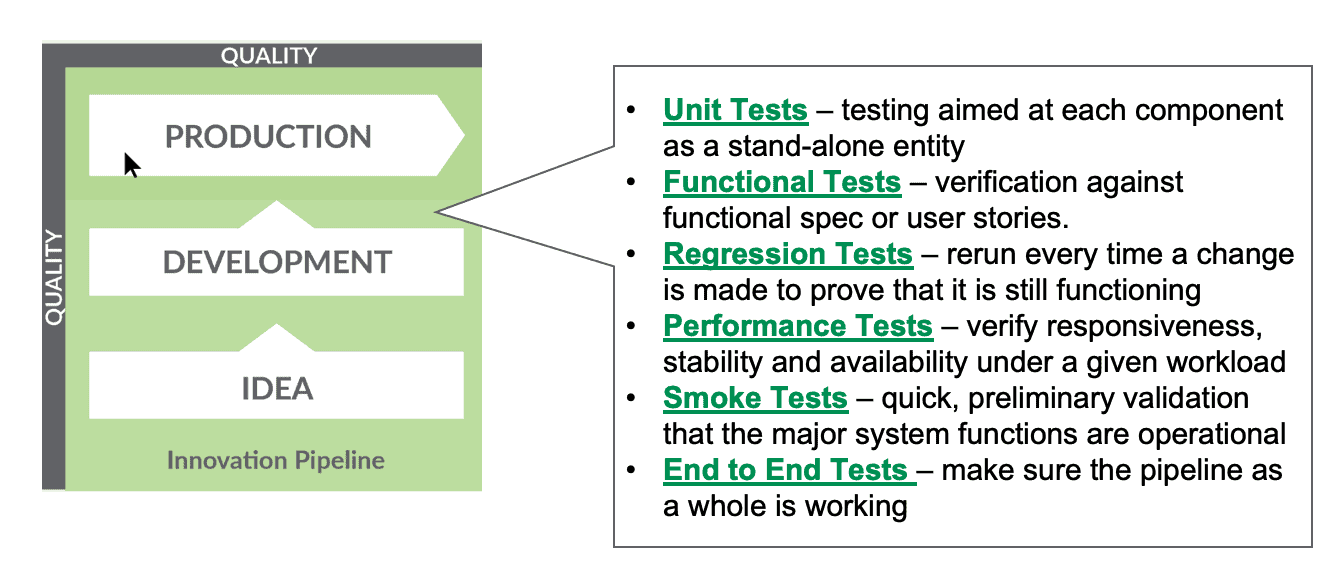
The software industry has decades of experience ensuring that code behaves as expected. Each type of test has a specific goal. With cloud capabilities and infrastructure-as-code methodologies, data organizations encounter less resistance to accumulating large test suites. In general, when we speak of testing in data analytics, more is better. If you spend any time discussing testing with your peers, the following terms are sure to come up:
Unit Tests
Software developers run unit tests to ensure that a section of code (a “unit” that implements a specific feature or function) fulfills its function and operates correctly. A unit test could consume a range of inputs, including some corner cases, and verify that application behavior or results match expectations. Parameterizing unit tests can improve test efficiency and productivity by enabling one test to cover many cases. If a data analytics project is divided among several data scientists or analysts, then each contributor could write unit tests to verify their piece of code. Unit tests apply to each component of an application separately and pave the way for integration testing.
Integration Tests
Integration Tests focus on the interaction between components to ensure that they are interoperating correctly. Whereas unit tests focus on one specific unit of the application, integration testing utilizes multiple units to verify that they are working together correctly. The most straightforward integration test strategy verifies the application as a whole. Software developers have devised several other approaches to integration testing which determine which units to test together.
Functional Tests
Functional Tests derive from the functional specification (or user stories) of the software under test. Each feature requirement is verified independently by providing inputs (or conditional scenarios) and verifying the correctness of outputs or application response. Functional testing is usually performed as black-box testing, meaning the tests focus on application outputs and behaviors without any knowledge of internal architecture or underlying implementation.
Regression Tests
A software regression is a bug or error introduced by a change, such as a code enhancement or an environment upgrade. Regression Tests are essentially a battery of tests that can be rerun after a change is made to prove that an application is still functioning. A regression test demonstrates that previously validated features continue to operate correctly once new features or enhancements have been deployed.
Performance Tests
Performance Tests verify a system’s speed, responsiveness, stability, reliability, scalability and availability under a given workload. Performance tests can reveal shortcomings in a system architecture. In DataOps, performance tests can measure the speed of common workflows: analytics development environment creation, analytics deployment, and time-to-resolution of production errors. Improving the performance of routine tasks significantly impacts a data organization’s agility. If these workflows are not automated, you may find them to be a drag on data organization productivity.
Smoke Tests
Smoke Tests quickly validate that major system functions are operational. A smoke test has several important uses. If a system stops executing, a smoke test on major subsystems can quickly determine whether analytics components are “up and running.” Sometimes smoke testing is used as an initial qualification before running an extensive test suite.
Test Metrics
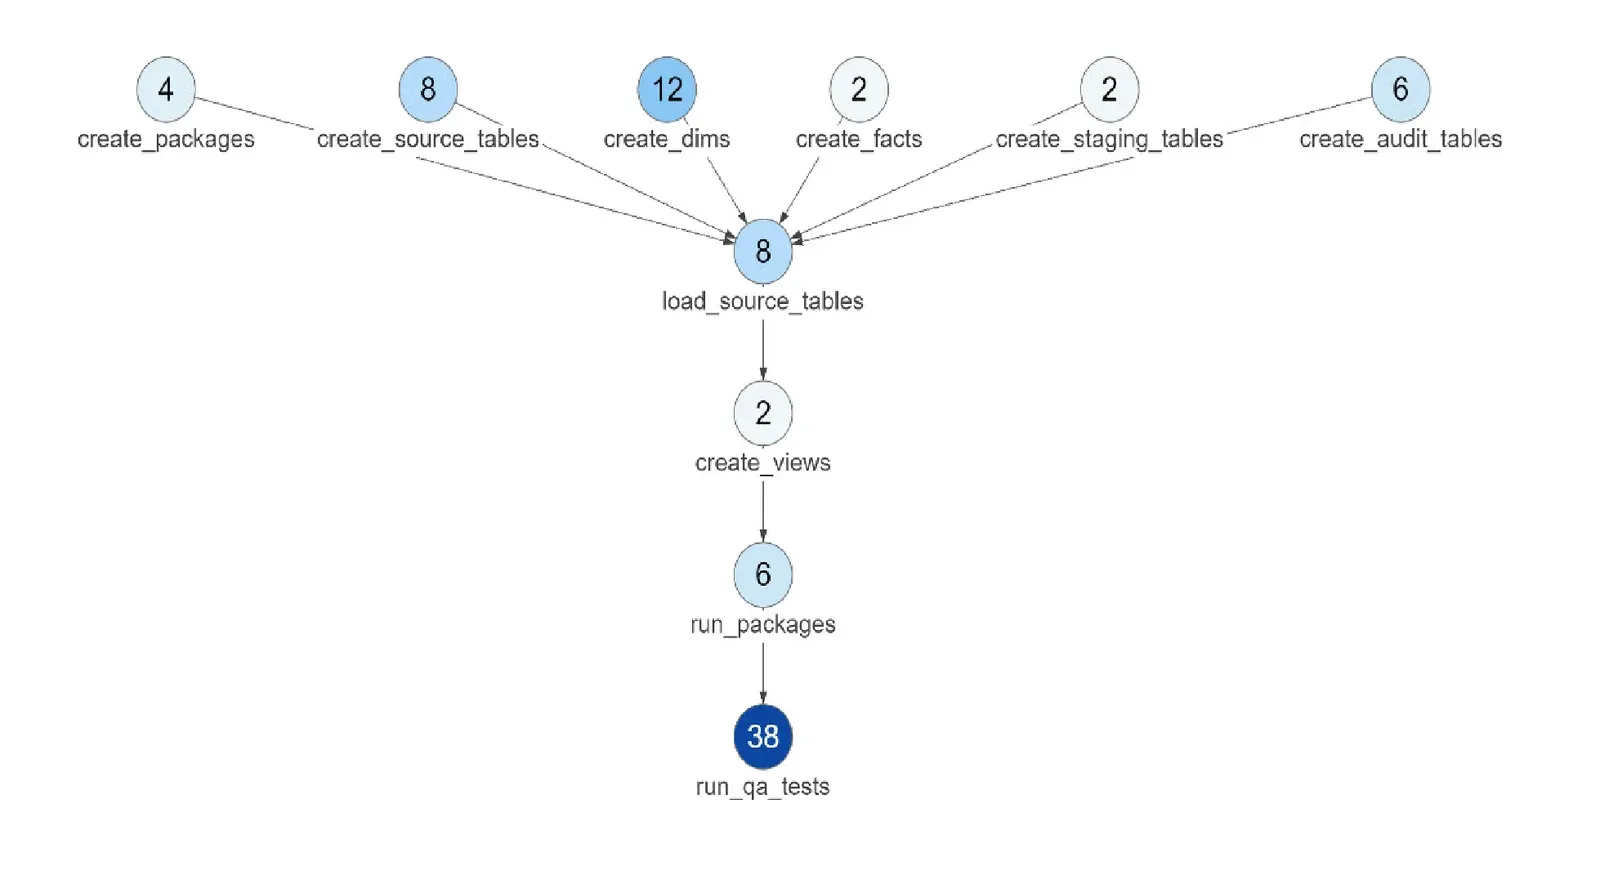
Test metrics can help determine whether test coverage is adequate. Figure 7 below shows the number of tests in each node of execution in an analytics pipeline, depicted as a directed acyclic graph. As a starting point, each node should have multiple tests. The number of tests should reflect the complexity of the system. Tests should cover all nodes and data sets, but should not overwhelm your processing resources.
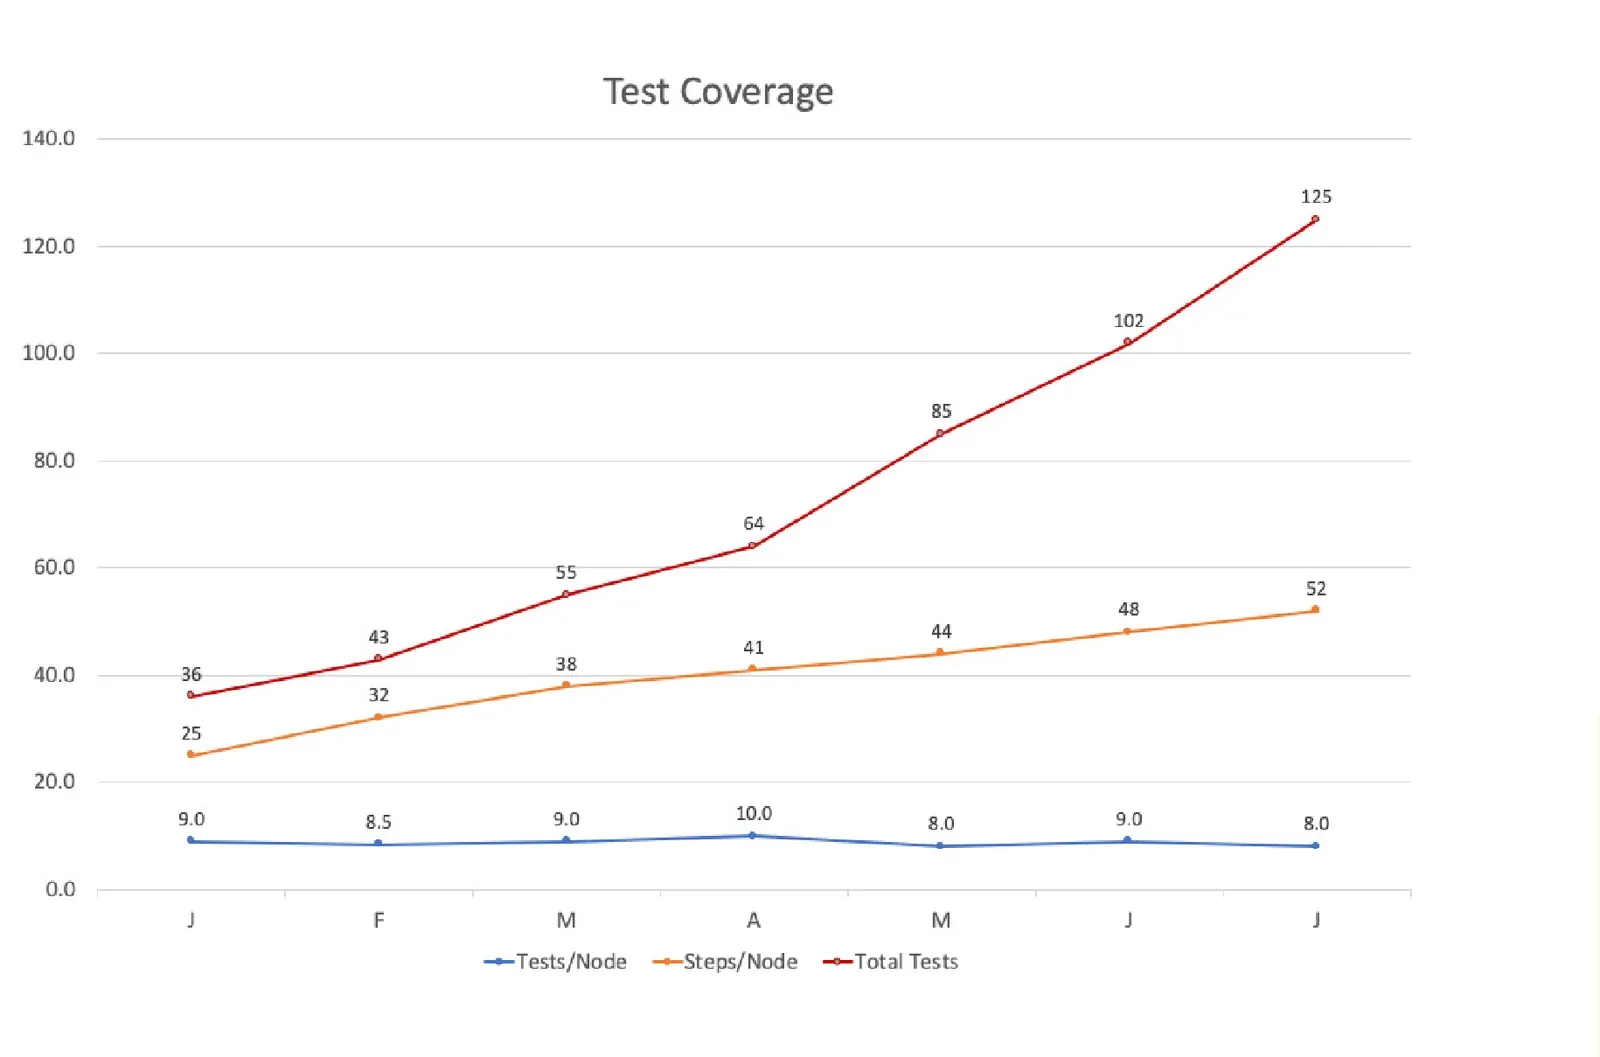
Metrics can also track the overall number of tests and the tests per execution node in the end-to-end system. In Figure 8, we see that even though the overall number of tests is increasing, the average number of tests per node has drifted downward. This feedback may encourage the team to slightly increase its test production.
The Role of a DataOps Platform
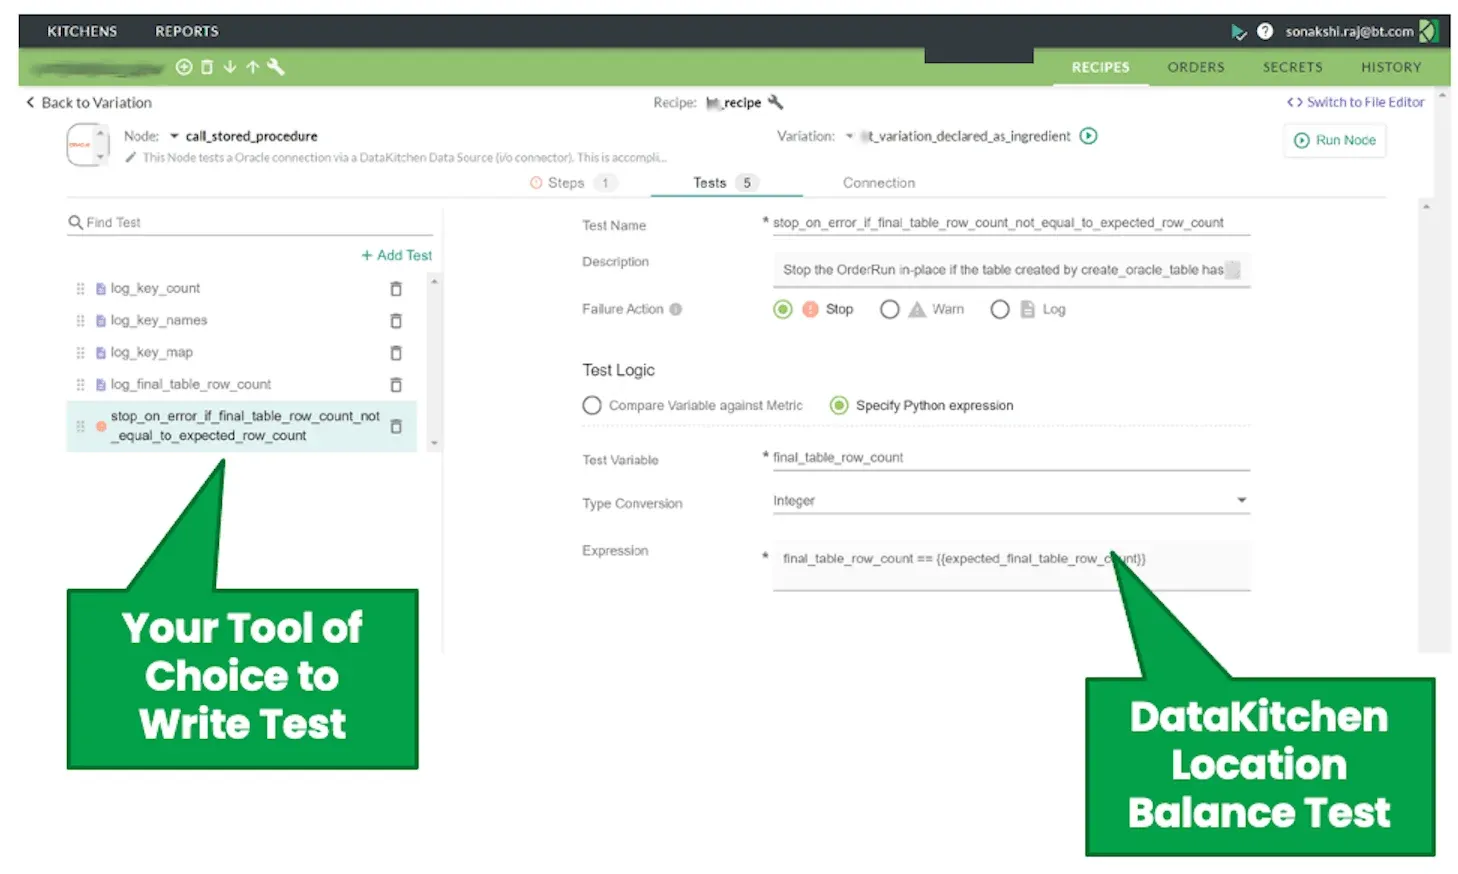
A DataOps Platform integrates the processing nodes in each data pipeline with their associated tests. It also creates a common framework that can accept heterogeneous tools used in each node. So each data engineer or data scientist can use the tool that they prefer and the DataOps Platform standardizes the interfaces.
The typical data pipeline uses numerous tools, each performing a specific job. The DataOps Platform spans the entire pipeline, from data sources to published analytics, allowing you to write tests for each and every step along the way. Imagine having to learn all of the tools in the data pipeline and writing tests within each tool’s domain for its subset of operations.
Conclusion
A unified, automated test suite that tests/monitors both production data and analytic code is the linchpin that makes DataOps work. Robust and thorough testing removes or minimizes the need to perform manual steps, which avoids a bottleneck that slows innovation. Removing constraints helps speed innovation and improve quality by minimizing analytics cycle time. With a highly optimized test process, you’ll be able to expedite new analytics into production with a high level of confidence.
For more on the practices this paper depends on, see Data Quality: The DataOps Way on running data quality as a continuous practice, DataOps Observability: Taming Chaos on tracking every journey data takes from source to customer value, DataOps TestGen on generating these tests automatically from a data profile, and 7 Steps to Implement DataOps, which opens with the same instruction to add tests.
FAQ
What is the main point of this paper?
Automated tests at every step of every data pipeline are what make DataOps work, and testing — not tooling — is the foundation of observability. A breadth of production data tests plus a development test suite for analytics code can drive a data organization’s error rate to virtually zero. Writing a few unit tests and calling it DataOps is not enough.
What is a location balance test?
A location balance test ensures that data properties match business logic at each stage of processing. If an application expects 1 million rows to arrive via FTP, the test verifies that 1 million rows arrived, that the same quantity is present in the database, that it survives the intermediate pipeline stages, and that the corresponding facts and dimension members appear in the report.
What is a historical balance test?
A historical balance test compares current data to previous or expected values, using history as the reference for whether today’s numbers are reasonable. A test might check the top fifty customers or suppliers and flag values that moved up or down unexpectedly. It gives the data team advance warning that a number will look wrong to users.
What is statistical process control in a data pipeline?
Statistical process control, also called a time balance test, repeatedly measures an aspect of the data pipeline and screens the measurements for error or warning patterns. It is borrowed from lean manufacturing, where every aspect of the process is measured to detect issues as early as possible. It lets a data team catch failures before users see them in reports.
Why is testing the foundation of data observability?
An observable system is architected with transparency and instrumentation, giving a complete picture of the data pipelines. In DataOps, tests are what provide status at each stage of processing. Without tests there is nothing to report, so a manager asked what went wrong, when, and why has no answers. Tests supply the process transparency that observability depends on.
How much time should a data team spend writing tests?
In a DataOps enterprise, members of the analytics team spend about 20% of their time writing tests. Whenever a problem occurs, a new test is added so the same failure cannot recur silently, and new tests accompany every analytics update. The breadth and depth of the test suite therefore grows continuously rather than being built once.
What are data input, output, and business logic tests?
Data input tests stop erroneous data from entering subsequent pipeline stages, the equivalent of incoming quality control in manufacturing. Data output tests verify that a pipeline stage executed correctly. Business logic tests validate data against tried and true assumptions about the business — for example, that every European customer is assigned to a member of the Europe sales team.
What are the failure modes for a failed data test?
Three. An error is fatal and stops the pipeline, the data equivalent of stopping the manufacturing line. A warning requires investigation by a member of the data analytics team, who checks whether a source or a definition changed. Informational output is context-dependent and helps the data engineer monitor routine activity or investigate a failure.
Why does DataOps testing have to cover data as well as code?
Because data changes continuously as it flows through the system. It can drift out of statistical range, defy data prep algorithms, and confuse machine learning models. DevOps testing focuses on verifying code, which is only half the problem in analytics. DataOps testing must cover both analytics code and the data moving through it.
Why is manual testing not good enough?
Manual testing is performed step by step by a person, so it consumes a precious resource such as a data scientist to run tests one at a time. It is expensive, prone to human error, and usually too cumbersome to run often. Automated tests execute under orchestration, which makes them cheaper, more reliable, and repeatable.
What types of tests apply to analytics code in development?
Unit tests verify that one section of code fulfills its function. Integration tests check that components interoperate. Functional tests verify features against the specification, usually as black-box tests. Regression tests prove an application still works after a change. Performance tests measure speed, stability, and scalability under load. Smoke tests quickly confirm major system functions are operational.
How do you know whether test coverage is adequate?
Count the tests at each node of execution in the pipeline and track the trend. Every node should have multiple tests, scaled to the complexity of the system, covering all nodes and datasets without overwhelming processing resources. Watch total tests and tests per node together: rising totals with flat tests per node mean coverage is thinning as the pipeline grows.
What role does a DataOps platform play in testing?
A DataOps platform integrates the processing nodes in each data pipeline with their associated tests and provides a common framework that accepts the heterogeneous tools used at each node. It spans the pipeline from data sources to published analytics, so a team writes tests in one place rather than learning every tool’s own testing domain.
Get the PDF
The full paper is on this page. Fill in the form for a PDF copy to keep or share.