Mission Control for Every Data Journey
NOTE
This paper was updated in August 2026. It was first published in October 2022, when Observability was SaaS-only. The most important correction: it now runs as DataKitchen-hosted SaaS or self-hosted on Kubernetes or Docker Compose, and there is an Apache 2.0 open-source edition. This update also adds the fifteen integration agents, the rules engine, the Observability API, how Observability and TestGen divide the work, a dated summary of what the release notes have added since 2022, and a section on what Observability deliberately does not do. The core model — journeys, components, events, rules — is unchanged. For figures that move between releases, the documentation is authoritative.
DataKitchen’s DataOps Observability provides visibility across your data operations so you can see how everything performs in real time, respond quickly to problems, and make improvements. The application monitors every data journey from data source to customer value, from any development environment to production, across every tool, team, environment, and customer.
DataOps Observability ingests events from your data journey tools and infrastructure. Events include pipeline or tool start, end time, current state, infrastructure status, log events, and data quality test results. It associates those events with a specific data journey instance, then uses a rules engine to compare them against expectations and determines if any events meet predefined conditions to trigger actions, such as alerts, new events, or tests. These details are displayed as data journeys in the application.
DataOps Observability provides data teams with critical features and benefits.
- Data journeys allow monitoring of every data process from source to customer value.
- Production expectations featuring data, tool, and infrastructure testing reduce embarrassing errors to zero, making root cause analysis possible.
- Real-time alerting and immediate responses to failures mean quick fixes before harmful code reaches production or bad data reaches your customer.
- Testing development tools and data increases the delivery rate and lowers the risk of deploying new analytic insights.
- An intuitive, role-based user interface allows all stakeholders, from developers to customers, to be on the same page.
- Off-the-shelf connections and an OpenAPI enable fast implementations without replacing your existing tools or changes to existing pipelines.
- Event storage and historical dashboards enable you to catch negative trends early and track improvements.
Understand Your DataOps Issues
If you work in a data-related field, you already know there are problems in your data processes and problems across the industry that still need to be fully resolved. The cost of continually implementing temporary fixes to these problems is far greater than implementing a DataOps Observability solution.
Poor data quality: A “hope and pray” culture is common. Data teams never know if their tooling or integrations will break and end up “firefighting” when things inevitably go wrong. It’s embarrassing — and potentially costly — when customers find and report data issues the data team should have noticed.
Lack of visibility: With thousands of data journeys running and hundreds of tools supporting them, it is challenging to know if your entire data estate is working correctly at any given time. You can’t answer basic questions about the status of your production processes. And your teams and stakeholders have yet to share a common context about what’s happening.
Work disruptions: Daily work is interrupted to find and fix errors, resulting in delayed features, innovations, and customer deliveries.
Team frustration: Data engineers feel pressure and leave their jobs for more productive environments or careers.
DataOps Observability gives you the tools to minimize or resolve these issues. It offers visibility across your operations so you can see, in real time, how everything is going. The case for that visibility — the errors, the survey numbers, and the anatomy of a data journey — is the subject of the companion paper, DataOps Observability: Taming Chaos. This paper is about the product that implements it.
Essential Product Features
The DataOps Observability system ingests events from the tools and assets in your data estate. It correlates and filters this information to display and alert you to the status of your operations and the problem areas that require action. Observability can trigger pre-defined responses, such as sending events to a pipeline, running tests, or generating tickets in a system like ServiceNow.
The following product features and capabilities in the Observability product can help resolve your DataOps issues.
Complete Data Journey Observability
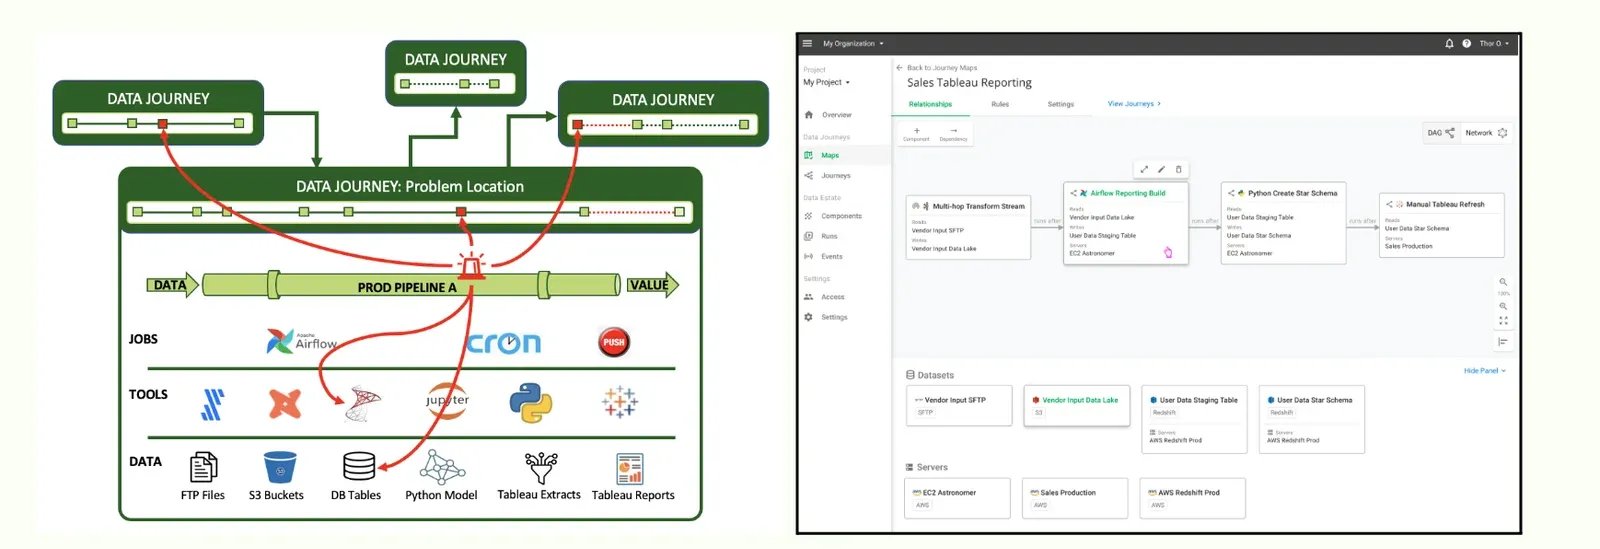
You need visibility across the breadth and depth of your data estate. Observability can monitor every step in — and relationship among — multiple data journeys (representations of groups of related pipelines), even crossing organizational boundaries. And it can track execution up and down any complex stack of jobs, tools, and data in each pipeline.
Data Journey Components Represent Your Data Estate
Components represent the resources, engines, and tools you use daily to deliver data analytic assets. Components can include batch pipeline runs executed by orchestrators, streaming pipelines in event-driven systems, datasets like database tables and files, and storage or computing infrastructure. Observability can integrate with any technology you use now or in the future.
Every event the system receives or creates is associated with a specific component.
| Component type | Definition | Example |
|---|---|---|
| Batch pipeline | A batch, or finite, tool for data engineering. | An Apache Airflow DAG. |
| Streaming pipeline | A stream of event data. | An event-based process enabled by, for example, Apache Kafka. |
| Dataset | A specific collection of data. | An Amazon Redshift table or a folder in an Amazon S3 bucket. |
| Server | Storage or computing infrastructure. | An Amazon EC2 server running Airflow jobs. |
Data Journey Projects
Different teams and projects can manage many data journeys in an organization. DataOps Observability groups all data journeys into a Project for simplifying and sharing your data journey information.
Capturing Data Journey Events
DataOps Observability collects event data through its API. Its events cover the significant activities of your data estate. Event data reflect the state, actions, and quality of your pipelines and data tools, not the data those tools act upon.
| Event type | Description |
|---|---|
| Run Status & Schedule | Describes a change in status (running, completed, completed with warnings, failed) for a specified batch pipeline run. |
| Message Log | Logs a string message related to the pipeline and optionally related to a specific task. Logs capture failure, warning, or debugging messages from external tools and scripts. |
| Metric Log | Captures the value of a user-defined datum of interest, such as a row count, cost, or CPU percentage. Used for tracking a metric through a run or comparing it across multiple runs. |
| Test Outcomes | Describes the results of a test or a set of tests executed on an external testing tool, such as DataKitchen’s DataOps TestGen. |
| Dataset Operation | Reports a read or write operation on a specified dataset component. |
Data Journey Expectations and Alerts
You can define your production expectations to reduce embarrassing errors to zero. You can measure the variances during and after each run by establishing baselines — concrete expectations for run schedules and durations, data quality, and dependencies.
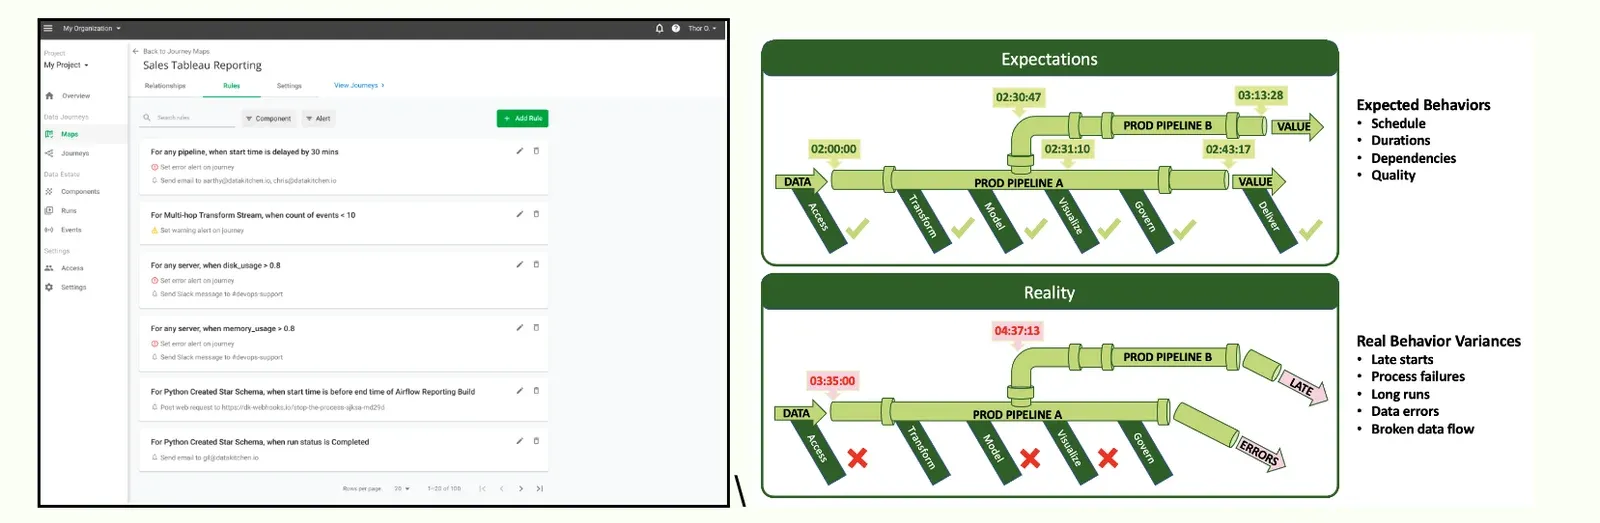
Additionally, DataOps Observability accepts log scraping data from other tools and can consolidate real-time and logged events into critical alerts.
Event Engine to Apply Rules and Actions
The event information that Observability captures can invariably be a lot of data for someone to monitor and sift through. The DataKitchen product includes an event engine that can react to what’s happening in the journeys and cut down the signal-to-noise ratio.
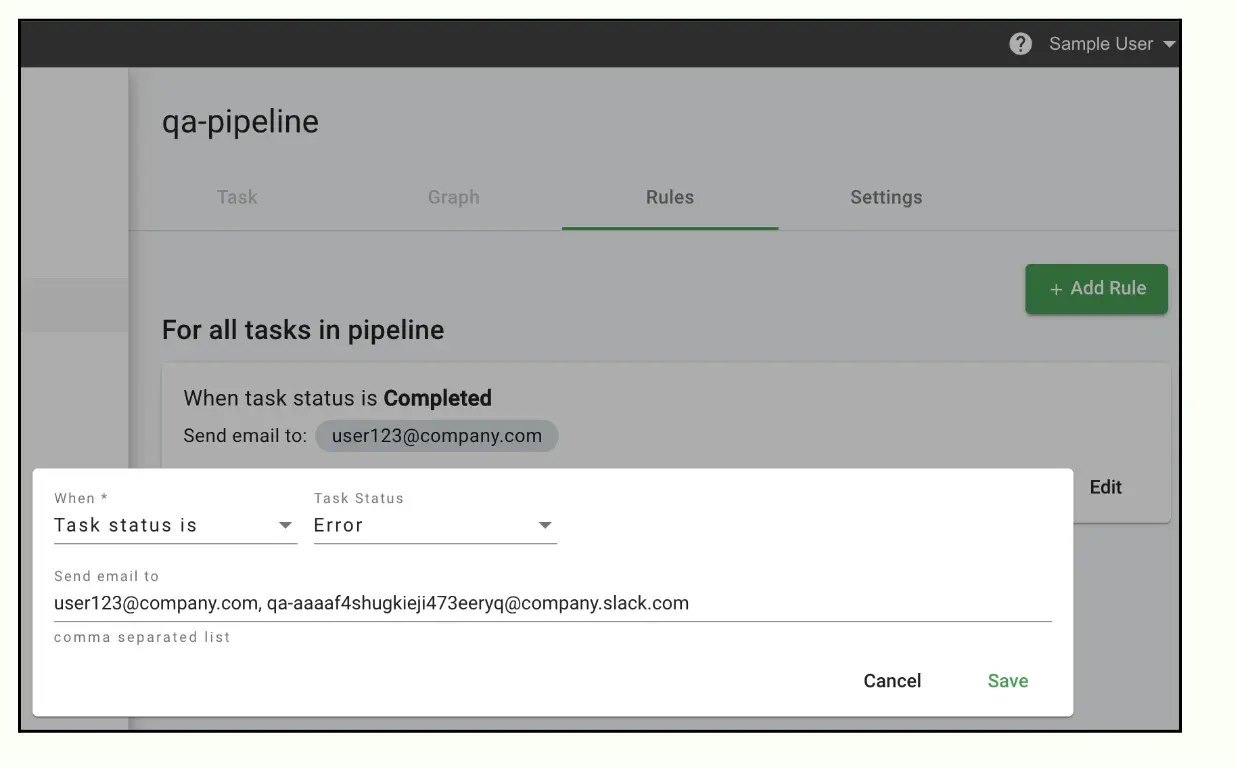
Given a set of rules, the event engine can trigger notifications through email, Slack, and other services, send alerts to your operations people, issue commands to start or end pipeline runs and prompt other actions when the difference between expected results and actual runs exceeds your tolerance thresholds.
Rule examples
- When test status is passed for any component in the journey, then send an email to
<email address one>,<email address two>. - When the log matches level = any and the message contains
^This exact message only$, for<a specific batch pipeline>, send a webhook request to<URL>, then specify the payload and, optionally, the headers. - When metric matches key =
<key>and value =<value>for<a specific dataset>, then send an email to<email address>. - When the run has an alert of type Late Start or Late End for any component in the journey, send a webhook request to
<URL>, then specify the payload and, optionally, the headers. - For more examples, see the documentation.
Development Data and Tool Testing
You can catch and fix errors in production and during development by implementing development data and tool testing. The downstream effects are increased delivery rates and reduced risk of deploying new insights.
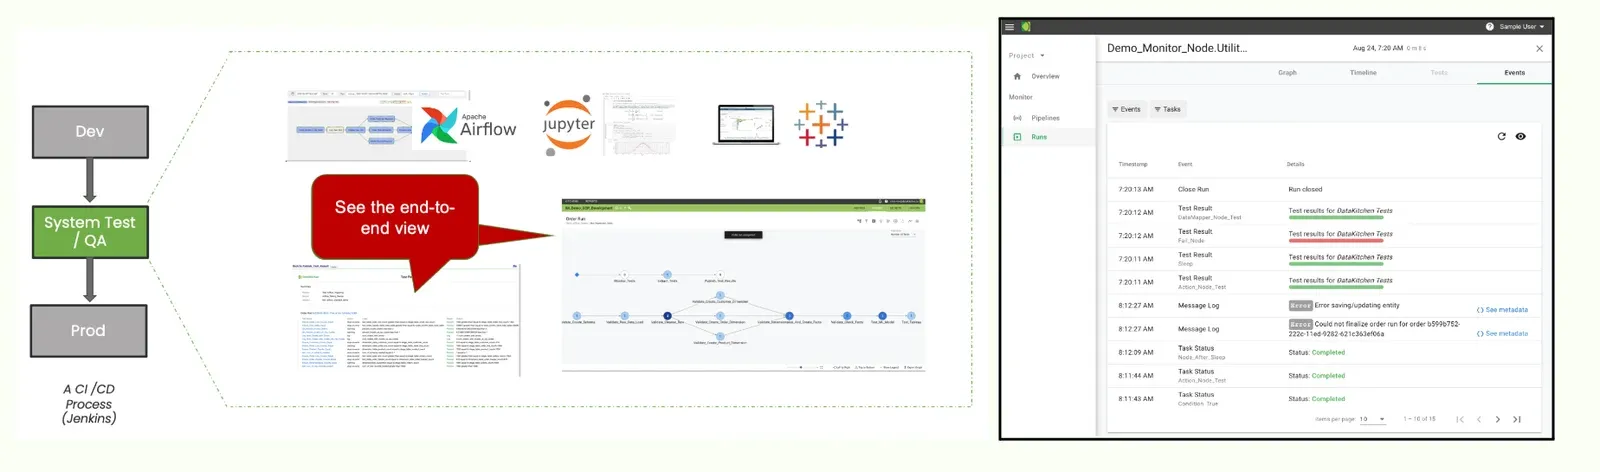
Observability enables you to watch the schedule and duration of your runs. Still, more importantly, you can check that the contents of your pipelines — the data, the models, the integrations, the reports, and the outputs your customers see — are as accurate, complete, and up to date as expected. With Observability, you can implement automated tests the product consumes as events.
Tests that evaluate your data and its artifacts check data inputs, transformation results, model predictions, and report consistency. They range from typical software development tests (unit, functional, regression tests, and so on) to custom data tests (location balance, historical balance, data conformity, data consistency, business logic tests, and statistical process control). These tests can be developed and executed via any method, including frameworks like DataKitchen’s TestGen or dbt.
Event Storage for Diagnosis and Historical Analysis
With Observability, you get real-time details and a store of run data over time. Use this information to diagnose problems and surface trends for statistical process control analysis.
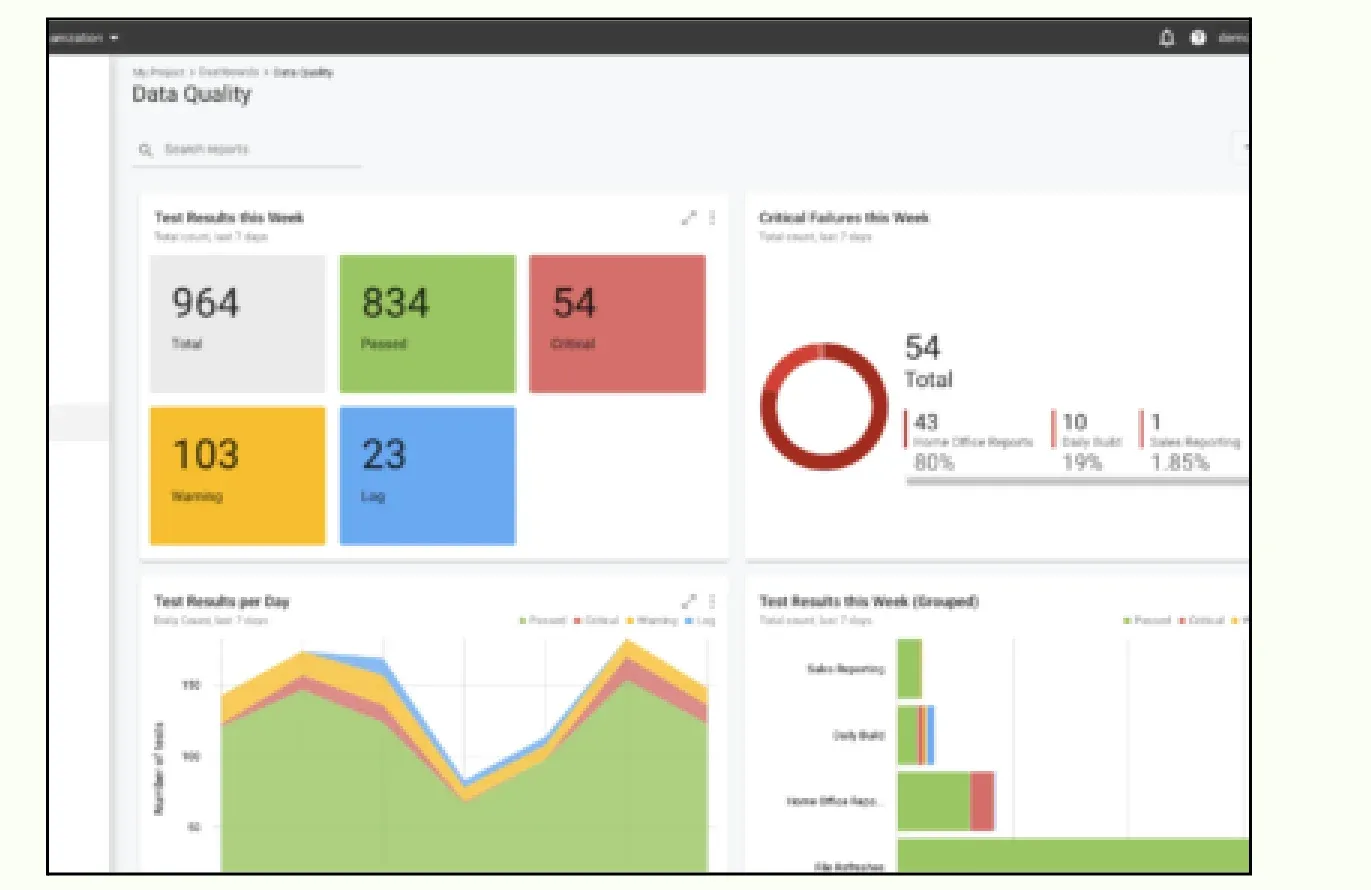
Success is not just about knowing what happens during the operation; it’s also about what happens after the process. By storing run data, Observability allows your analysts to look at variances from a historical perspective and make adjustments. Finding trends and patterns can help your team optimize your data pipelines and predict and prevent future problems.
With this information, you can create historical dashboards to simplify root-cause diagnosis and enable your teams to locate the sources of issues quickly.
Role-Based User Interface for Everyone
Easy to understand and navigate, your DataOps Observability tenant is designed to be accessible to all. The user interface allows everyone on the team — IT, managers, data engineers, scientists, analysts, and your business customer — to be on the same page. And quite literally, too. Use the unique URLs the system generates to quickly share specific data, save significant instances, and bookmark events for future insight.
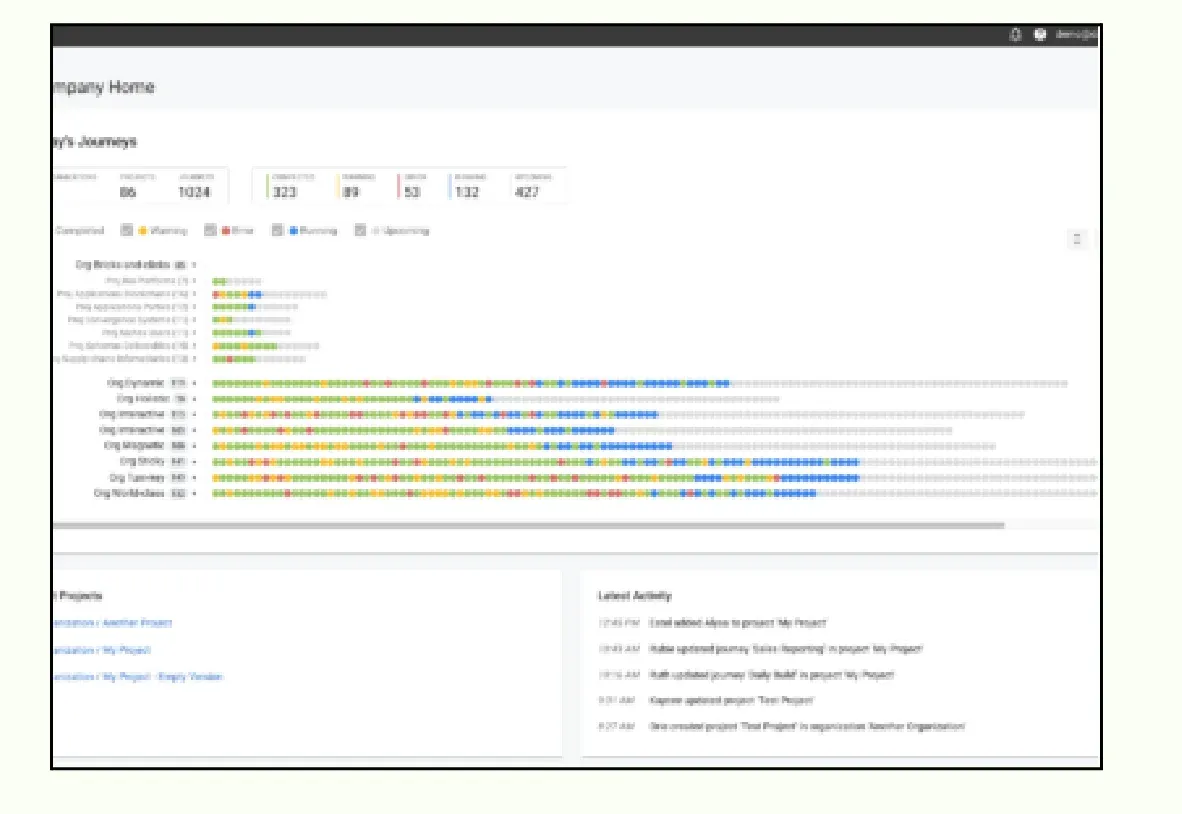
Different audiences need different cuts of the same events, which is why personalized views for data consumers matter as much as the engineer’s view of a failing task.
Data Toolchain Integrations with Observability
Tool Integrations with OpenAPI
Pre-built integrations and an OpenAPI specification (OAS) enable quick integrations without replacing existing tools. You can start transmitting events to and receiving commands from Observability right away.
Integrating your infrastructure and tools with the Observability system lets you publish event information to the system’s REST API. As Observability ingests those events, it translates, collates, and displays the critical event information you need to see.
DataKitchen recommends three methods for publishing events to Observability’s Event Ingestion API: (1) use the DataKitchen integration agent to request events from your resources — DataKitchen provides a growing list of off-the-shelf agents for many of the most popular data tools available today, and a 15-business-day SLA for delivering new or updated connectors to commercial tools in your data estate; (2) post events directly to the API; (3) publish via a client SDK generated by Swagger Codegen.
The Event Ingestion API can auto-generate client SDKs for interacting with the API. See Swagger Codegen for more details. Following this process, DataKitchen developed a client library in Python available for you to use for your integrations.
| Publishing method | Implementation details | Best for |
|---|---|---|
| Observability agent | Observed components expose or publish events in a way that an agent can forward to Observability. DataKitchen provides ready-made agents for many everyday data science and data tools. | A large number of resources being observed, where augmenting each one to send events is prohibitive. |
| Direct API requests | The observed resource publishes events directly to the Event Ingestion API. | A small number of resources that are easy to augment to publish events. |
| API requests via client SDK | The observed resource publishes events via a client library generated by Swagger Codegen in the user’s programming language of choice. | A small number of resources that are easy to augment to publish events. |
DataKitchen offers three methods to publish events; agents may be the most straightforward. The current list of off-the-shelf agents is in the Observability integration documentation.
Integration with DataKitchen’s DataOps TestGen and DataOps Automation Products
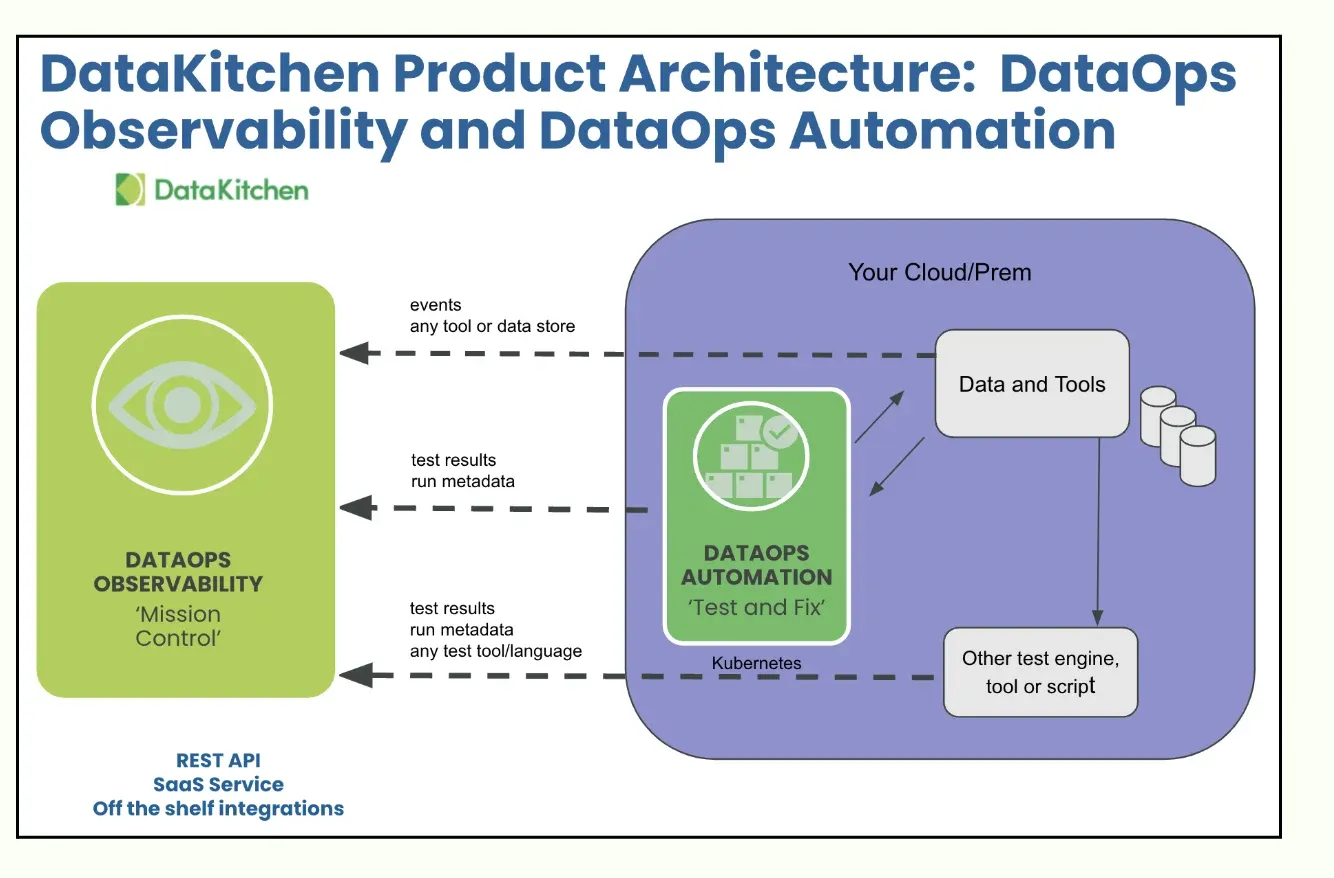
DataOps TestGen is a simple way to create and execute data quality validation tests against data in your databases. By profiling your data and automatically generating a standard set of validations, TestGen eliminates the need to write custom tests for many scenarios. When more custom tests are required, DataOps Automation provides a framework for building and executing complex tool, model, and API-level tests. Both products automatically forward test results to DataOps Observability.
TIP
DataOps TestGen is open source and free to run against your own database. Install Open Source TestGen and its test results can be forwarded to Observability as Test Outcomes events.
DataOps Observability Architecture
NOTE
This paragraph described the 2022 position and is no longer true. At first publication Observability was SaaS-only, with self-hosting listed as a future release. Self-hosting shipped. You can now run Observability as SaaS, or in your own environment on Kubernetes or Docker Compose, and there is an open-source edition under Apache 2.0 that is fully functional for a single data engineer, alongside Enterprise. The diagram below shows the SaaS topology; in a self-hosted deployment the same components run inside your network instead.
Observability runs as a DataKitchen-hosted service or entirely in your own
environment. Self-hosted installs use Docker Compose or Kubernetes; the
open-source edition installs with a single dk-installer command and Docker.
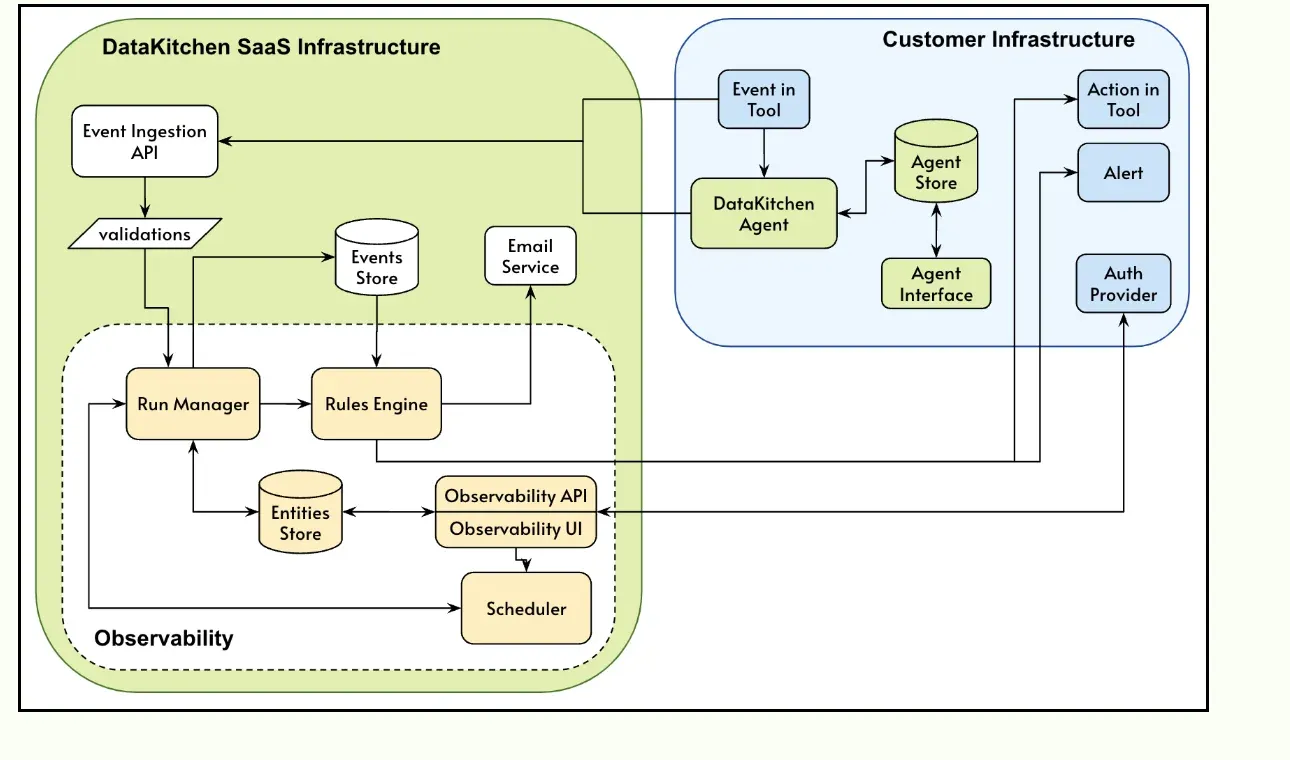
- Customer infrastructure: Sends events from local tools to the Event Ingestion API directly or via an agent. May receive alerts and take actions based on pipeline task settings and run states.
- Base infrastructure: Collects events via the agent and sends them through the Event Ingestion API and a series of validations into an Events Store.
- Observability application: The pipeline run manager creates runs, manages tasks, sets run states as they occur, and sends run events to the Rules Engine for evaluation. The Observability API and Observability UI authenticate users and display pipeline run information.
Secure Infrastructure
DataKitchen leverages the most sophisticated automation, scaling, cloud security, and authentication technologies for its DataOps Observability offering. The result is a secure and resilient service, giving you the confidence to monitor your most sensitive and complex data workloads with DataKitchen.
Where Observability runs as DataKitchen-hosted SaaS, that infrastructure includes end-to-end encryption for data in transit and at rest, built-in redundancies, and high availability. Where you self-host, those properties are yours to configure and no data reaches DataKitchen at all. It is subject to regular vulnerability assessments and penetration tests.
Event Ingestion API
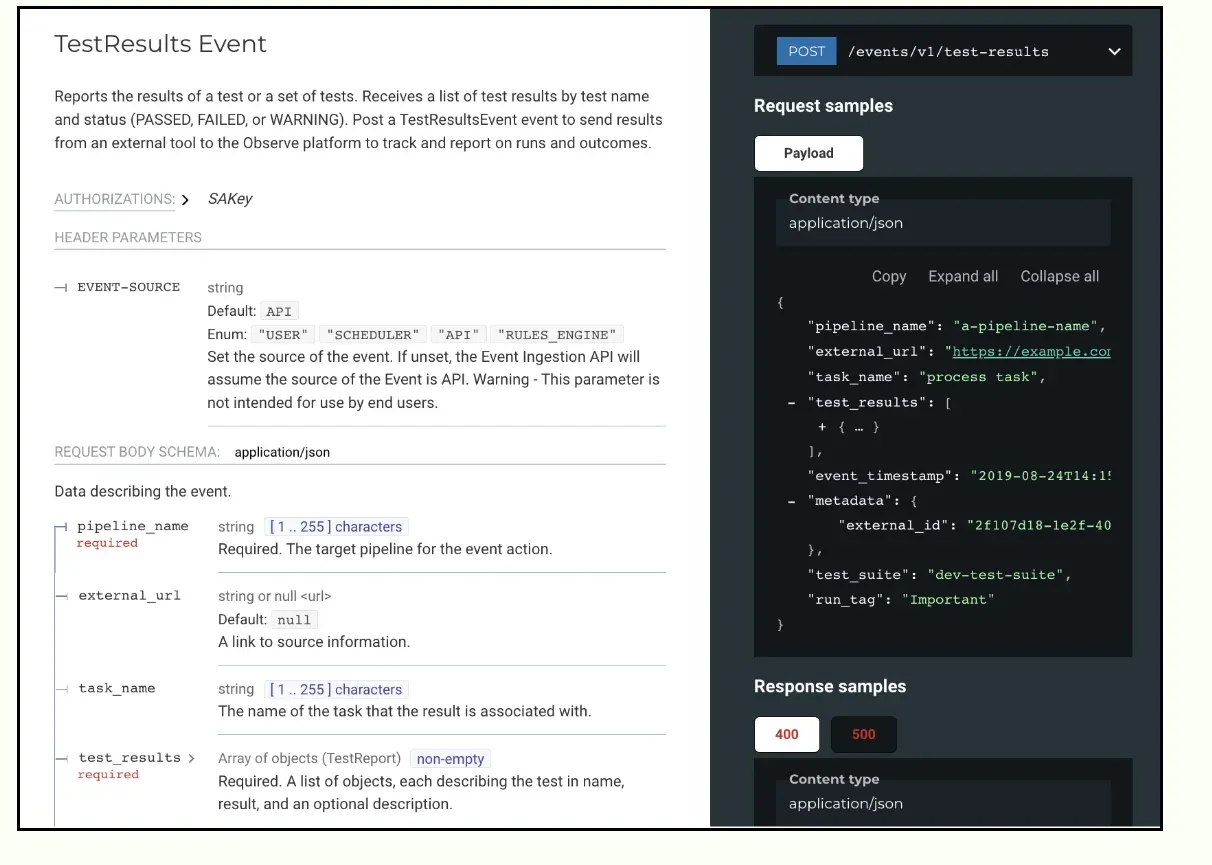
The Event Ingestion API is a set of POST-only endpoints for receiving events from external tools, scripts, or DataKitchen’s integration agent. It checks that each event is sent with a valid service account key and that the data schema of the event is valid for the specified event type.
Event endpoints
| Endpoint | Posts |
|---|---|
DatasetOperation | A read or write operation on a specified dataset component. |
MessageLog | A string message related to a pipeline, and optionally to a specific task. |
MetricLog | The value of a user-defined datum of interest, such as a row count, cost, or CPU percentage. |
RunStatus | A change in status for a specified batch pipeline run. |
TestOutcomes | The results of a test or a set of tests executed on an external testing tool. |
The API adheres to standard security practices by requiring authentication with service account (SA) keys. Find details in the Event Ingestion API documentation and more information in the Observability integration help topics.
Integration Agents
Events reach Observability three ways: a tool posts to the Event Ingestion API directly, a script posts on its behalf, or a pre-built integration agent extracts them. The agents are Docker images you deploy next to the tool they watch, and fifteen ship today:
| Category | Agents |
|---|---|
| Orchestration | Airflow, Google Cloud Composer, AutoSys, Microsoft SSIS |
| Transformation and platforms | dbt Core, Databricks, Azure Data Factory, Azure Synapse, Talend |
| Storage | Amazon S3, Azure Blob Storage |
| Compute | Azure Functions |
| Analytics and BI | Microsoft Power BI, Qlik |
| Pipeline monitoring | Fivetran Log Connector |
Since March 2026, journeys can also discover components on their own. You define include and exclude patterns against component keys, and anything arriving through the events API that matches gets added to the journey automatically. On a large estate that is the difference between maintaining a journey by hand and having it maintain itself.
That list is the practical answer to the question this paper opens with. A data journey crosses tools owned by different teams; the agents are how you observe it without asking every team to instrument their own work. Available agents.
The Rules Engine
Rules turn events into action, and they operate at the journey level so a rule can reason about the whole deliverable rather than one task. Each is a trigger-condition-action: pick the event that fires it, narrow it with conditions, optionally scope it to a single component, then choose what happens.
Two actions exist. Email to one or more recipients. Web request, where you set the method, URL, payload and headers — which is how Observability posts into Slack, Jira, Microsoft Teams or anything else with an HTTP endpoint. The docs carry walkthroughs for the common targets.
Rules also cover the observability tool itself. Since August 2024 you can configure an email or webhook to fire when Observability loses contact with an integration agent — so a silent agent raises an alarm instead of looking like a quiet pipeline. That distinction matters: absence of events and absence of problems are not the same thing.
This is the mechanism behind a claim made elsewhere in DataKitchen’s material: that issue routing belongs in the tools your team already uses. The rules engine is the bridge, not a second ticket queue.
Two APIs
The paper describes the Event Ingestion API below. There is a second one worth knowing about: the Observability API reads and configures what the Event Ingestion API writes into — journeys, components, instances, rules and project settings. The Event Ingestion API reference covers the POST-only side.
How Observability and TestGen Fit Together
The two products answer different questions and the division is worth stating plainly, because prospects routinely ask which one they need.
TestGen answers is this data correct — it profiles a database, generates tests, and runs them in place. Observability answers did the process run correctly — what ran, in what order, on time or late, with which results, and where the chain stopped. A TestGen result arrives in Observability as a test on a dataset component, which puts a data quality finding in the context of the run that produced it.
That is also DataKitchen’s answer on lineage. Observability tracks process lineage rather than column-level data lineage, on the argument that when data breaks the useful question is which process ran wrong, not which column feeds which column. A column graph tells you what could be affected; it rarely tells you what happened at 2am.
What Has Changed Since This Paper Was First Published
Taken from the release notes. The entries that change how you deploy or operate the product, rather than the maintenance releases:
| Release | Date | What it changed |
|---|---|---|
| 2.0 | April 2024 | Observability became open source under Apache 2.0, fully functional for a single data engineer, with Enterprise alongside it. This is the release that made the SaaS-only statement in this paper obsolete. |
| 2.2.0 | August 2024 | Alerts when Observability loses contact with an integration agent, by email or webhook. Faster instance DAG rendering. |
| 2.3.0 | November 2024 | Date-range filtering on All Events; component pages link directly to their events and runs; faster event loading. |
| 2.5.0 | April 2025 | Batch pipeline events link to the run that produced them; timelines separate runs and tasks that occur close together; Docker images moved to the official Python image on Alpine Linux. |
| 2.7.0 (Enterprise) | April 2025 | Violin charts for run durations grouped by week in email reports. |
| 2.8.0 | November 2025 | Docker Compose installation on Windows, Mac and Linux — the release that delivered self-hosting. |
| 2.9.0 | March 2026 | Log search on the All Events tab. |
| 2.11.3 | March 2026 | Component autodiscovery for journeys, using include and exclude patterns on component keys. |
| 2.12.4 / 2.12.5 | 2026 | Fixes and security hardening; no new capability. |
Two of these matter more than the rest. Open source at 2.0 and Docker Compose at 2.8.0 together turn “SaaS-only, self-hosting is a future release” into “run it wherever you want” — which is why the note at the top of this paper exists.
What DataOps Observability Does Not Do
It is not a data lineage tool. No column-level graph. See the section above for the reasoning; if you already have lineage from a catalog, or a work graph such as an Airflow DAG, that can be combined with Observability’s run history externally.
It is not an issue tracker. The rules engine routes findings into Jira, ServiceNow, Slack or Teams. Assignment, escalation and closure live there.
It does not test data. Observability ingests test results; it does not generate or run data quality tests. That is TestGen’s job, and the two are designed to be used together rather than as alternatives.
It does not instrument tools by itself. An agent, a direct API post, or a script has to send events. Fifteen agents cover common tools; anything else needs an Event Ingestion API call.
Observing the Observability Industry
Many tools use the term “observability” today. How can you tell the difference between them? There are several key ideas to consider. First, IT hardware monitoring and application performance monitoring (APM) checks, like disk and CPU, while helpful, are often lagging indicators of problems with your data journeys. Second, you need to check and validate the source data, the integrated data, and the things created from the data (like reports and models) to ensure data journey success. And third, you need the ability to test that the relevant tools, jobs, and code acting on the data are behaving as expected, and to know the run-time lineage of the whole system.
| Category | Key challenge | DataOps Observability difference |
|---|---|---|
| Data observability tools — Monte Carlo, Acceldata, Bigeye, and others | These tools test data in the database or data store. DataOps Observability does that, plus correlates it to the other critical elements of the data journey, where a fundamental understanding is required. | DataOps Observability produces source-to-consumer data journeys; these tools do not. It can correlate events and logs from these vendors and others in one place and one view. |
| IT observability tools — Datadog, New Relic, AWS, Azure, and GCP monitoring services | These tools are valuable but incomplete. They monitor servers and networks, which is needed. However, problems in data and analytic systems span hardware, software, tools, raw data, integrated data, and the code that drives those tools. | DataOps Observability is built upon the concept of data journeys and tests, a feature lacking in those IT tools. It can correlate events and logs from these vendors with any other critical signals in one place and one view. |
| IT logging tools — Splunk, Devo, Microsoft Sentinel, Azure Monitor | These technologies are valuable but incomplete, and provide a limited set of signals within a pipeline. | DataOps Observability produces and observes data journeys and tests, and these tools do not. DataKitchen can correlate events and logs from these vendors with any other critical signals in one place and one view. |
| Build vs. buy | It will take many months to develop and support the backend and user experience needed to support a scalable DataOps Observability solution. | DataOps Observability offers a consumption-based pricing model that allows users to adopt the platform at their own pace. The product can also integrate internally developed observability capabilities into a consolidated view. |
The distinction that matters most in practice is the one between data quality testing and observability: testing tells you whether a dataset is right, and observability tells you whether the process that produced it ran, ran on time, and ran on the data you expected. Both halves are needed, which is why data in place and data in use are treated as two sides of the same problem.
DataOps Observability Technical Requirements
How you start depends on the deployment you want.
Open source, self-hosted. Install with Docker: create a directory, download
dk-installer.py, and run python3 dk-installer.py obs install. It needs Python
3.9–3.13 and Docker with Compose, takes five to fifteen minutes, and writes your
credentials to dk-obs-credentials.txt. Default port 8082.
Enterprise, self-hosted. Docker Compose or Kubernetes. DataKitchen suggests a Linux VM with at least 4 CPUs, 16 GB memory and 100 GB disk for enterprise workloads. Enterprise adds single sign-on, user access control, multi-project management and custom branding.
SaaS. Contact your DataKitchen representative to set up the required infrastructure for your Observability account. This configuration includes your company account, initial user accounts, authentication service connection, unique user interface URL, default account entities, and service account keys for API access.
Why DataKitchen’s DataOps Observability?
DataKitchen’s DataOps Observability is your mission control for every data journey in your enterprise. Data journeys span from data sources to customer value, go from any development environment into production, and provide monitoring across every tool, every team, every environment, and every customer.
DataKitchen’s DataOps Observability detects, localizes, and provides a shared context so problems can be understood and acted upon immediately.
In a world of complexity, failure, and frustration, data and analytics teams need to deliver insight to their customers with few errors and a high rate of change. You don’t have to live with these problems. DataKitchen DataOps Observability provides the solution.
The critical feature — support for data journeys — allows monitoring of every data process from source to customer value. Production expectations reduce embarrassing errors to zero, including data and tool testing. Development cycle data validation and tool testing increase the delivery rate and lower the risk of deploying new analytic insights. Historical dashboards enable you to find the root causes of issues and constantly improve. An intuitive, role-based user interface allows all stakeholders to be on the same page. Off-the-shelf integrations and an open API enable fast implementations without replacing your existing tools.
When you aim to produce rapid, trusted customer insight, you need to start by reducing your team’s hassles and embarrassment while increasing the time it has to develop and deliver. You can lower your error rates and achieve your goals by monitoring all data journeys. Keep your tools and infrastructure the same; use the DataKitchen DataOps Observability product on top of those tools. Observability is also the practical first step into a full DataOps practice, because you cannot improve a data estate you cannot see.
Spend less time worrying about what may go wrong and gain more time to create by observing every data journey and taking early action to stay on track.
Additional Resources
- DataOps Observability: Taming Chaos — the companion paper, ungated
- Observability Functional Brief (PDF)
- What is DataOps Observability? — the definitional Q&A
- DataKitchen DataOps Observability help
- Event Ingestion API documentation
Related Reading
- Introducing the Five Pillars of Data Journeys — what a journey actually observes
- Map and Monitor Your Data Journey — the visibility problem this product solves
- Data Teams and Their Types of Data Journeys — how journeys get scoped in real organizations
- Data Journey First DataOps — why the journey, not the pipeline, is the unit of observation
- DataOps Observability and Automation to the Rescue — the two products working together
- Stick Thermometers in Data Journeys — instrumentation and statistical process control
- The Difference Between Data Quality and DataOps Observability
- DataOps Observability: Taming Chaos — the case for journeys, with the survey numbers
- DataOps TestGen White Paper — the test-generation half of the toolchain
- Data Quality: The DataOps Way — what to test, and where
FAQ
What is the main point of this paper?
DataOps Observability watches every data journey from source to customer value by ingesting events from the tools a team already runs. It associates each event with a specific journey instance, compares it against expectations with a rules engine, and acts when the difference exceeds a tolerance threshold. This paper is the technical anatomy of that: component types, event types, publishing methods, the rules engine, and the architecture.
What is a data journey component?
A component represents a resource, engine, or tool used to deliver data analytic assets, and every event the system receives or creates is associated with one. There are four types: batch pipeline, such as an Apache Airflow DAG; streaming pipeline, such as an event process enabled by Apache Kafka; dataset, such as an Amazon Redshift table or an Amazon S3 folder; and server, such as an EC2 instance running Airflow jobs.
What kinds of events does DataOps Observability collect?
Five. Run Status and Schedule reports a change in status for a batch pipeline run. Message Log carries a string message from external tools and scripts. Metric Log captures a user-defined datum such as a row count, cost, or CPU percentage. Test Outcomes carries results from an external testing tool. Dataset Operation reports a read or write on a dataset component.
Does DataOps Observability read my data?
No. Event data reflects the state, actions, and quality of pipelines and data tools, not the data those tools act upon. Test results arrive as events from whatever test framework produced them, so the values under test stay in the customer’s own systems. That separation is what lets the product sit on top of an existing estate without moving data into it.
How do tools send events to DataOps Observability?
Three ways. A DataKitchen integration agent requests or receives events from a resource and forwards them, which suits a large number of observed resources where augmenting each one is prohibitive. A resource can post events directly to the Event Ingestion API. Or it can publish through a client SDK generated by Swagger Codegen in the language of choice.
What is the Event Ingestion API?
The Event Ingestion API is a set of POST-only endpoints that receive events from external tools, scripts, or the DataKitchen integration agent. It checks that each event carries a valid service account key and that the event’s data schema is valid for the specified event type. Endpoints cover DatasetOperation, MessageLog, MetricLog, RunStatus, and TestOutcomes events.
What are expectations in DataOps Observability?
Expectations are baselines — concrete definitions of run schedules and durations, data quality, and upstream and downstream dependencies. Once they are set, the variance between expectation and reality is measurable during and after each run. Late starts, long runs, process failures, data errors, and broken data flow all show up as differences against the baseline rather than as silence.
What can the event engine do when a rule fires?
Given a set of rules, the event engine triggers notifications through email, Slack, and other services, sends alerts to operations staff, issues commands to start or end pipeline runs, and prompts other actions when the difference between expected and actual results exceeds a tolerance threshold. Its job is to cut the signal-to-noise ratio so a person is not reading raw event streams.
How does DataOps Observability integrate with DataOps TestGen and DataOps Automation?
Both forward test results to DataOps Observability automatically. DataOps TestGen profiles data and generates a standard set of validations against databases, removing the need to hand-write tests for common scenarios. DataOps Automation provides a framework for building and running more complex tool, model, and API-level tests. Observability consumes the outcomes of either as Test Outcomes events.
What does the DataOps Observability architecture look like?
Three tiers. Customer infrastructure sends events from local tools to the Event Ingestion API, directly or via an agent, and can receive alerts and take actions. Base infrastructure collects events, runs them through validations, and stores them in an Events Store. The Observability application runs the pipeline run manager, the rules engine, the API, and the UI.
How is DataOps Observability different from data observability tools like Monte Carlo?
Data observability tools test data in the database or data store. DataOps Observability does that and correlates the results with the other elements of the data journey — the jobs, tools, code, and infrastructure that produced the data. It produces source-to-consumer data journeys, which those tools do not, and it can ingest their events and logs into the same view.
How is it different from IT monitoring and logging tools like Datadog or Splunk?
IT observability and logging tools monitor servers, networks, and log streams, which is necessary but incomplete. Problems in data and analytic systems span hardware, software, tools, raw data, integrated data, and the code driving those tools. DataOps Observability is built on data journeys and tests, a layer those tools lack, and can correlate their signals with the rest of the journey.
What does a customer need to provide to get started?
Setup is arranged with a DataKitchen representative and covers the company account, initial user accounts, the authentication service connection, a unique user interface URL, default account entities, and service account keys for API access. Once the keys exist, any tool that can make an HTTP request — or that has an off-the-shelf agent — can start publishing events.
Can DataOps Observability run in my own environment, or is it SaaS only?
Both. It runs as DataKitchen-hosted SaaS, or self-hosted in your own environment on Kubernetes or Docker Compose. There is also an Apache 2.0 open-source edition that is fully functional for a single data engineer, alongside Enterprise. At first publication in 2022 it was SaaS-only with self-hosting listed as a future release; self-hosting shipped.
Which tools does DataOps Observability integrate with out of the box?
Fifteen integration agents ship today, each a Docker image deployed beside the tool it watches: Airflow, Google Cloud Composer, AutoSys, Microsoft SSIS, dbt Core, Databricks, Azure Data Factory, Azure Synapse, Talend, Amazon S3, Azure Blob Storage, Azure Functions, Microsoft Power BI, Qlik, and the Fivetran Log Connector. Anything else sends events through the Event Ingestion API.
How does the rules engine send alerts to Slack or Jira?
Rules work at the journey level as trigger, condition, action. Pick the event that fires the rule, narrow it with conditions, optionally scope it to one component, then choose an action. Two actions exist: email to named recipients, or a web request where you set method, URL, payload and headers. That web request is how findings reach Slack, Jira or Microsoft Teams.
What is the difference between DataOps Observability and DataOps TestGen?
TestGen answers whether the data is correct: it profiles a database, generates tests, and runs them in place. Observability answers whether the process ran correctly: what ran, in what order, on time or late, with which results, and where the chain stopped. A TestGen result arrives in Observability as a test on a dataset component, putting a quality finding in the context of the run that produced it.
Does DataOps Observability do data lineage?
Not column-level data lineage. It tracks process lineage instead, on the argument that when data breaks the useful question is which process ran wrong rather than which column feeds which column. A column graph tells you what could be affected; it rarely tells you what happened at 2am. Existing lineage or a work graph such as an Airflow DAG can be combined with Observability run history externally.
Get the PDF
The full paper is on this page. Fill in the form for a PDF copy to keep or share.