
Data Science workflows traditionally follow the trajectory of the path shown in Figure 1. Most projects naively assume that most of the time and resources will be spent in the “black box,” building the machine learning (ML) model, whereas a majority of the project time is actually needed in the green boxes – the ML system.
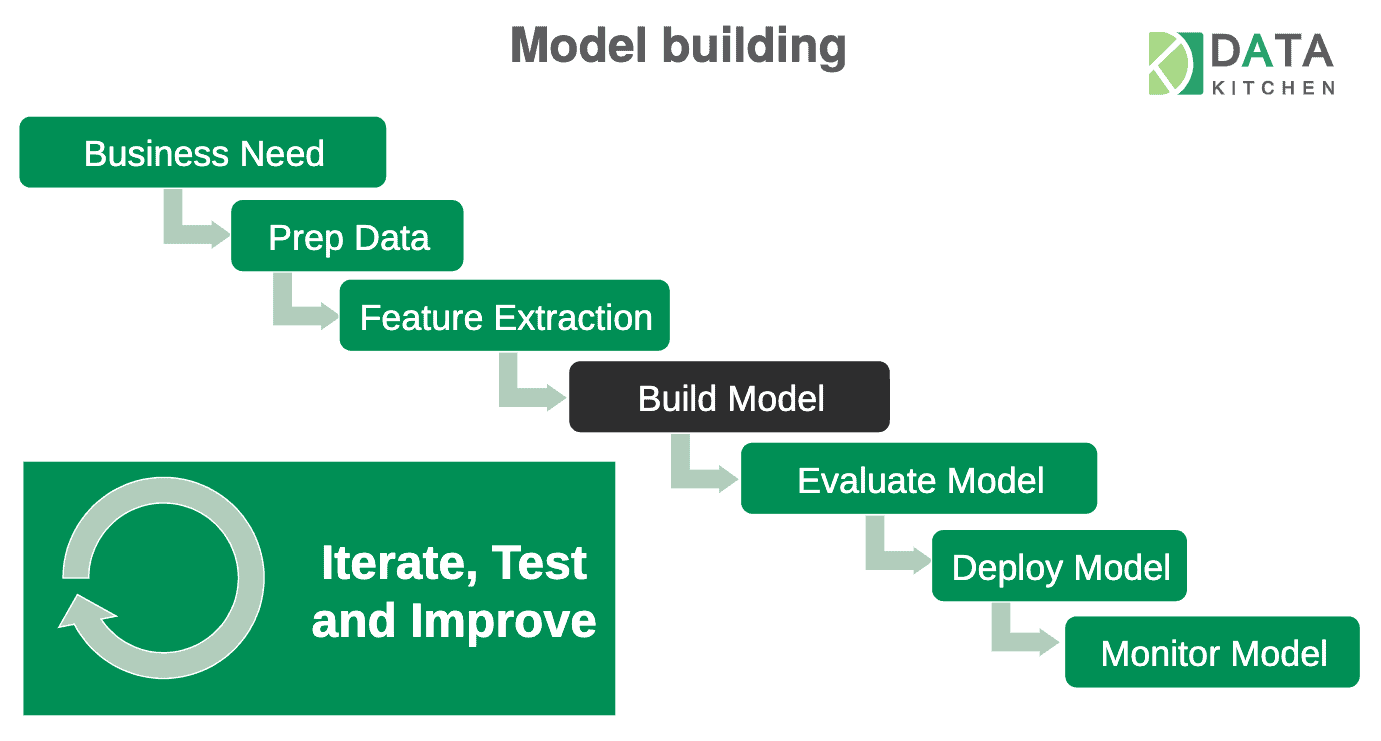
Figure 1: A traditional data science workflow often focuses exclusively on the model and neglects the system.
After building a model, it is typically deployed into production using slow, inflexible, disjointed, manual processes. Google classifies businesses practicing these rudimentary methods as MLOps Level 0. Characteristics include:
- Manual, script-driven, and interactive processes
- Disconnection between ML and operations
- Infrequent release iterations
- No Continuous Integration (CI)
- No Continuous Delivery (CD)
- Deployment focuses on the prediction service, not the ML system
- Lack of active performance monitoring
DataOps methods, backed by DataKitchen DataOps Automation, enable enterprises to address each of these Level 0 constraints. In machine learning contexts, DataOps practices are also known as MLOps or ModelOps. Continuous Delivery is one of the most challenging aspects of MLOps. In this post, we’ll focus on the “Evaluate Model” step shown in Figure 1.
In a traditional SDLC process, after a new chunk of code or a feature has been implemented, it undergoes DevOps automated testing. Tests defined in the CI/CD pipeline check if the code is deployable or not. A software application is tested once for each deployment of new code.
Machine learning systems differ from traditional software applications in that ML systems depend on data. A predictive ML model undergoes periodic retraining and redeployment as new data becomes available. Each time the model is updated, it must undergo testing before it is deployed. While a traditional software application could theoretically be deployed and forgotten, ML systems undergo a continuous cycle of periodic retraining, retesting and redeployment for as long as the model is in production. Evaluating model accuracy is very important in an ML continuous deployment. If an MLOps deployment determines that an updated model falls short of its target accuracy, then the orchestration can halt the deployment of the updated model or take some other corrective action. Designing an ML system that handles all of the contingencies of an ML continuous deployment may sound like a substantial undertaking, but it is quite simple when you use DataKitchen DataOps Automation.
ML System Evaluation with DataKitchen DataOps Automation
Imagine an enterprise that has deployed an ML system that forecasts sales of products. Figure 2 shows an end-to-end orchestrated pipeline which performs the following actions:
- Transfers data files from an SFTP server to AWS S3.
- Loads and validates the data from those files into a star schema in AWS Redshift.
- Forecasts sales using the SARIMA time series model defined in the Jupyter Notebook inspired from this github repository.
- Updates the data catalog.
- Publishes detailed reports in Tableau server.
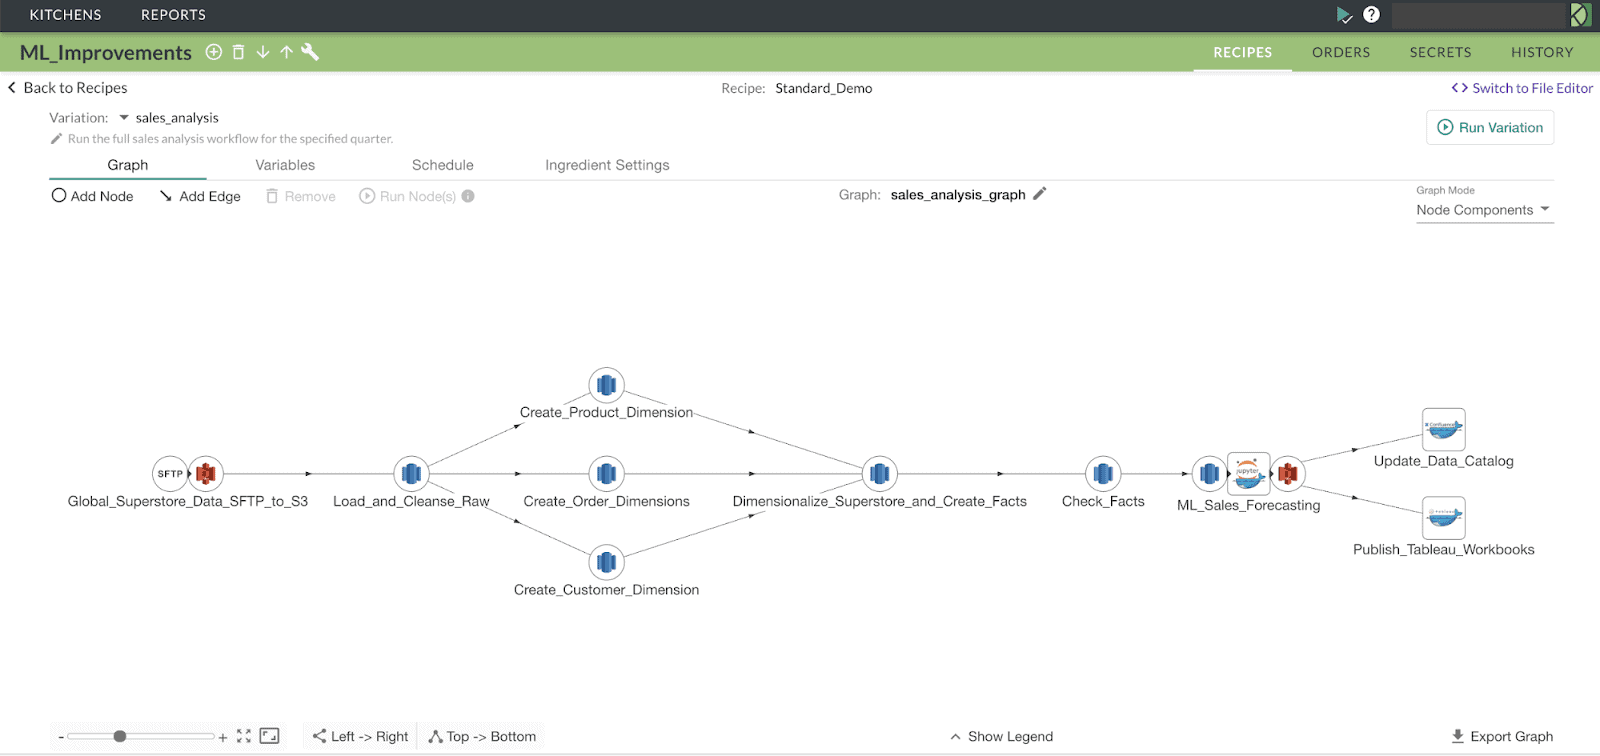
Figure 2: The graph represents an orchestrated ML system that forecasts product sales.
Suppose the enterprise wishes to update the sales forecasting models quarterly. DataKitchen DataOps Automation makes it easy to evaluate the updated model by extracting test metrics from the ML_Sales_Forecasting step, as shown in Figure 2. The deployed system contains three instances of a time series model, which forecast sales for three product categories, i.e., Furniture, Technology and Office Supplies. When new quarterly data becomes available, the model instances are updated. We can configure DataKitchen DataOps Automation orchestration to evaluate, log and take action based on the updated model’s performance.
Exporting and Testing Metric Values
An Order is scheduled within DataKitchen DataOps Automation to calculate the Root Mean Square Error (RMSE) after each batch of quarterly data becomes available. The RMSE metric enables DataKitchen orchestration to compare current model performance, using the most recent data, with historical results.
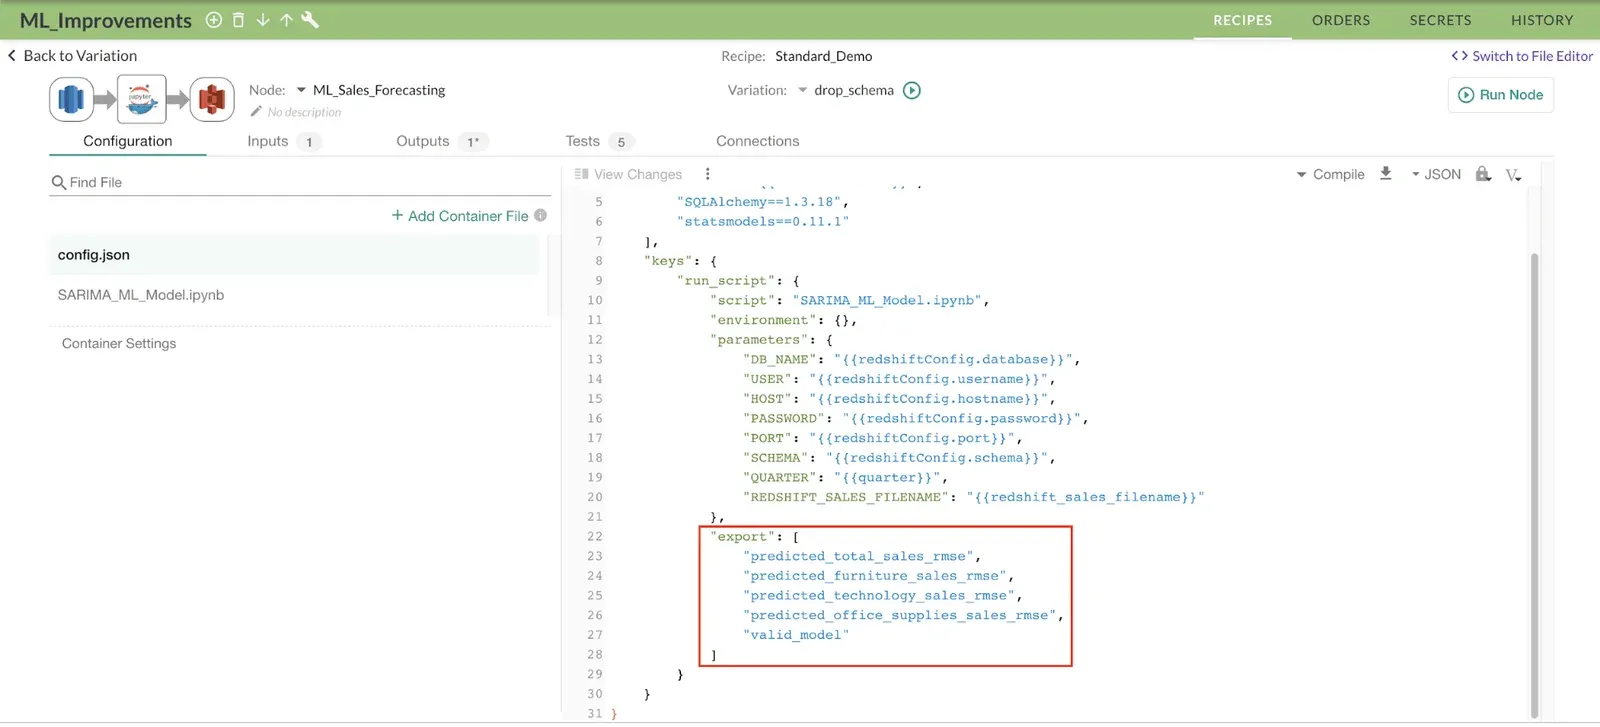
Figure 3: DataKitchen DataOps Automation exports scalar values which are used in data pipeline tests.
DataKitchen DataOps Automation provides the option of exporting scalar values of variables after a script has completed execution. In Figure 3, we export RMSE values for total sales, furniture, technology and office supply sales. In general, exported values can be numeric, text, boolean or date type.
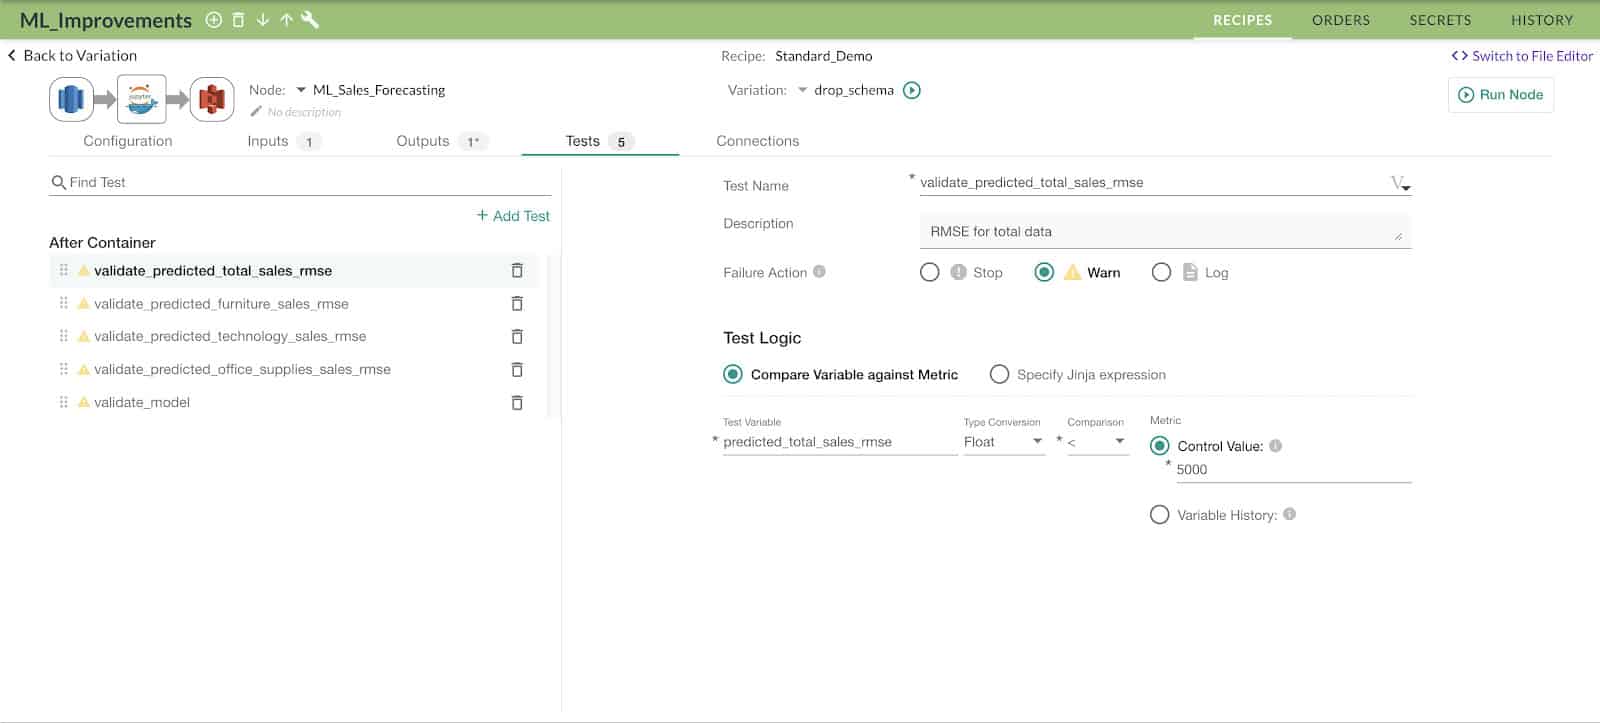
Figure 4: The DataKitchen UI enables the user to define tests that run as part of the data pipeline.
After the model metrics have been exported, they can be used to formulate tests as shown in Figure 4, where we conduct a simple test to see if the exported RMSE value is lower than the control metric (5000) as specified in the control value field.
If this test fails, then we have the option to either “LOG” the value, send a “WARN” message or “STOP” the execution of the recipe (orchestrated sequence) to prevent it from moving on to the next step.
Model Governance with DataKitchen
DataKitchen DataOps Automation stores the values of every exported test metric variable in a MongoDB backend. Historical order-run logging provides two benefits. First, it enables the Platform orchestration to natively compare a current variable value with a historical value. This feature, coupled with the test-failure control actions specified above, acts as an automated QA mechanism. It checks a model relative to its predecessor and prevents inferior models from being deployed to the production environment.
The second benefit relates to statistical process control (SPC) applied to exported metrics. The Platform provides native graphs of exported variable values over time. Example SPC graphs can be seen in Figure 5.:
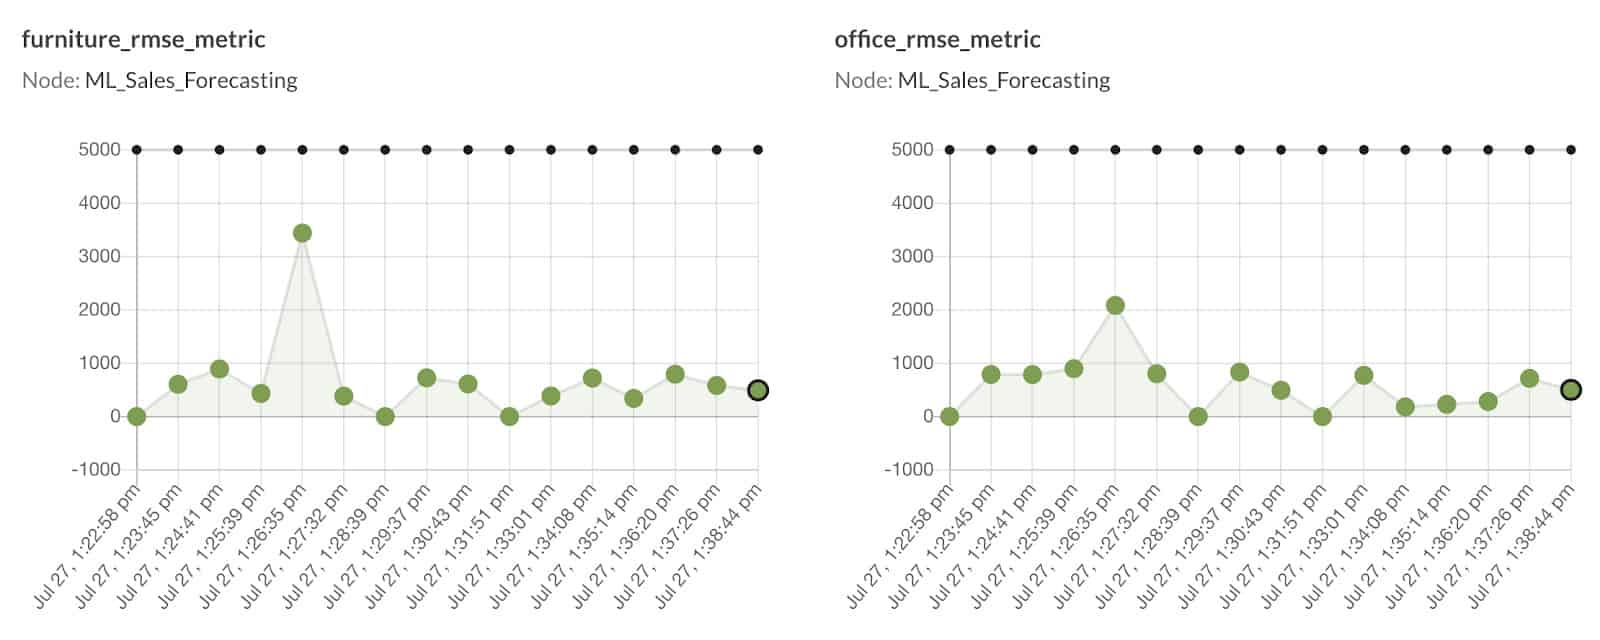
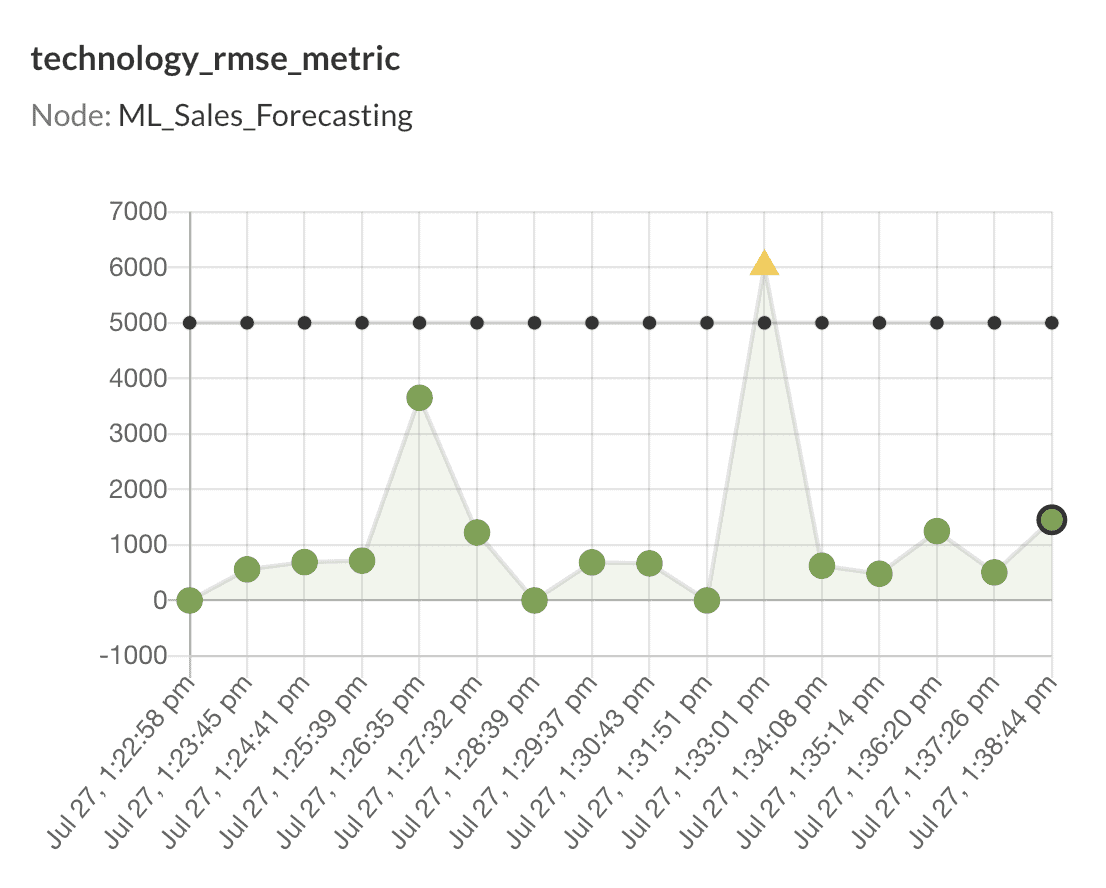
Figure 5: DataKitchen DataOps Automation natively displays statistical process control graphs.
The graphs provide a straightforward assessment of model performance. The Y-axes of the above graphs represent RMSE error metric values, whereas the X-axes represent the timestamp of each run (i.e., when new quarterly data was made available). The green-colored circles represent the data points, whereas the line composed of small black circles represents the control metric value. If the RMSE exceeds the control value, a message or action is triggered.
Note that in the technology_rmse_metric graph, there was one instance on July 27 at 1:33:01 PM when the RMSE value crossed the predefined threshold of 5000, raising a warning message that can be visibly seen by the yellow triangular tick.
These visuals are provided natively within DataKitchen DataOps Automation, but you also have the option to reproduce them in any visualization tool of your choice, for example, Tableau, which can be seen in Figure 6.:
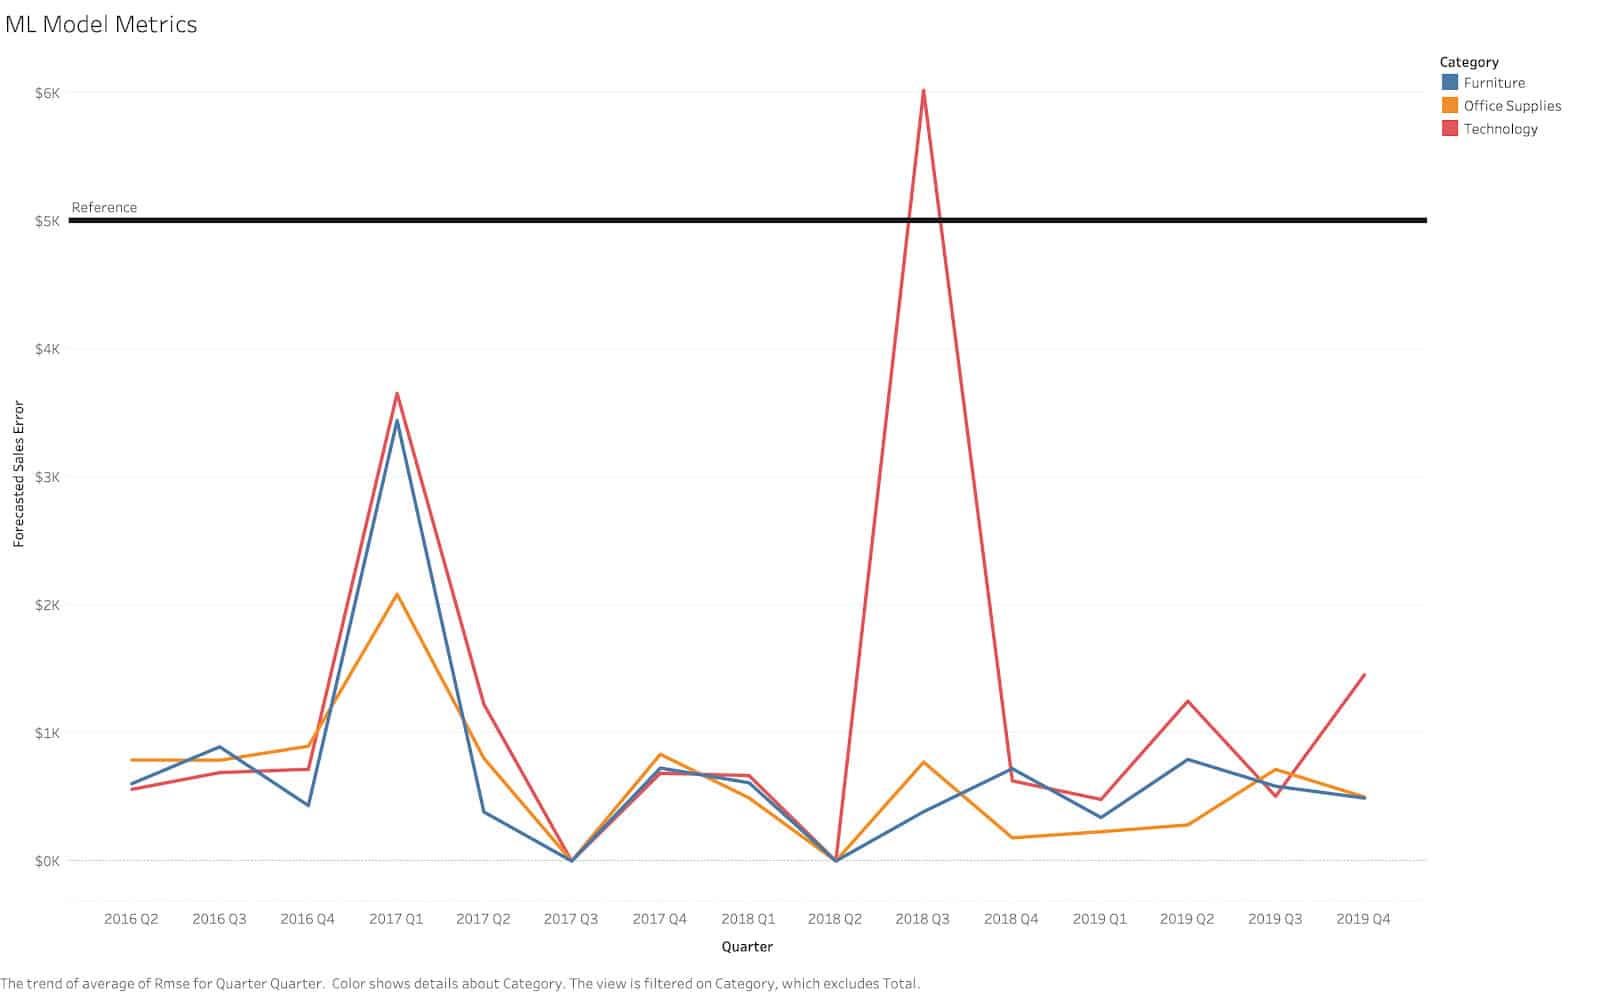
Figure 6: The SPC data easily exports to 3rd party visualization tools.
Conclusion
DataKitchen DataOps Automation makes it simple to apply statistical process control to machine learning models. We showed how a scheduled orchestration calculates and exports metrics that evaluate model performance over time. With DataKitchen DataOps Automation, data scientists can easily implement an automated MLOps and Model Governance process, thereby ensuring model quality and delivering a more robust ML pipeline.
FAQ
What are the key points in this blog?
Machine learning projects spend most of their effort on the system around the model, not the model itself. DataKitchen DataOps Automation evaluates each retrained model as part of the pipeline: a scheduled order computes Root Mean Square Error, a test compares it against a control value of 5000, and every exported metric is stored so orchestration can chart performance over time and block an inferior model.
What is MLOps Level 0?
MLOps Level 0 is Google’s label for machine learning run as a manual process. Its markers are script-driven, interactive workflows, a disconnect between the machine learning team and operations, infrequent releases, no continuous integration or continuous delivery, deployment aimed at the prediction service rather than the whole system, and no active performance monitoring.
Why does a machine learning model need testing more than once?
Because it depends on data that keeps changing. A predictive model is retrained and redeployed as new data arrives, so it has to be evaluated on every update rather than once at release. A traditional application can in theory be deployed and forgotten; a model in production runs a continuous cycle of retraining, retesting, and redeployment.
How does DataOps Automation evaluate an updated machine learning model?
It turns model metrics into pipeline tests. After the forecasting script runs, DataOps Automation exports scalar values — numeric, text, boolean, or date — such as Root Mean Square Error for each product category. A scheduled order recomputes them when a new quarter of data lands, and a test checks the value against a control metric. A failing test can log the value, warn, or stop the recipe.
What is statistical process control for machine learning models?
It is charting a model quality metric run over run and reacting when it leaves its expected range. Every exported metric is stored in a MongoDB backend, so DataOps Automation graphs Root Mean Square Error against the timestamp of each run alongside the control value. In the example, one run crossed the threshold of 5000 and raised a warning.
What does the example sales forecasting pipeline do?
It moves files from an SFTP server to S3, loads and validates them into a star schema in Redshift, forecasts sales with a SARIMA time series model defined in a Jupyter Notebook, updates the data catalog, and publishes reports in Tableau. Three model instances forecast Furniture, Technology, and Office Supplies, and they are updated quarterly.