Abstract
The data mesh design pattern breaks giant, monolithic enterprise data architectures into subsystems or domains, each managed by a dedicated team. With an architecture comprised of numerous domains, enterprises need to manage order-of-operations issues, inter-domain communication, and shared services like environment creation and meta-orchestration. A DataOps superstructure provides the foundation to address the many challenges inherent in operating a group of interdependent domains. DataOps helps the data mesh deliver greater business agility by enabling decentralized domains to work in concert. In this white paper, we’ll explore the benefits and challenges of implementing a data mesh and review lessons learned from a pharmaceutical industry data mesh example.
Thought leaders in the data analytics industry are coming to the conclusion that large, complicated centralized systems too often fail. Why is that, and what can be done about it?
Thoughtworks describes the evolution of the enterprise data platform architecture, which we will rephrase as follows:
First-generation – expensive, proprietary enterprise data warehouse and business intelligence platforms maintained by a specialized team drowning in technical debt.
Second-generation – gigantic, complex data lake maintained by a specialized team drowning in technical debt.
Third-generation – more or less like the previous generation but with streaming data, cloud, machine learning and other (fill-in-the-blank) fancy tools. And you guessed it, managed by a specialized team drowning in technical debt.
See the pattern? It’s no fun working in data analytics/science when you are the bottleneck in your company’s business processes. A barrage of errors, missed deadlines, and slow response time can overshadow the contributions of even the most brilliant data scientist or engineer. The problem is not “you.” It lies somewhere in between your enterprise data platform architecture and the enterprise’s business processes. Below are some reflections upon the failure of modern enterprise architectures to deliver on data analytics agility and reliability:
- Centralized Systems Fail – Lots of inputs and outputs; numerous fragile pipelines; hard to understand, modify, monitor, govern; billions of dollars have been (and will be) invested in vain trying to cope with this vast complexity.
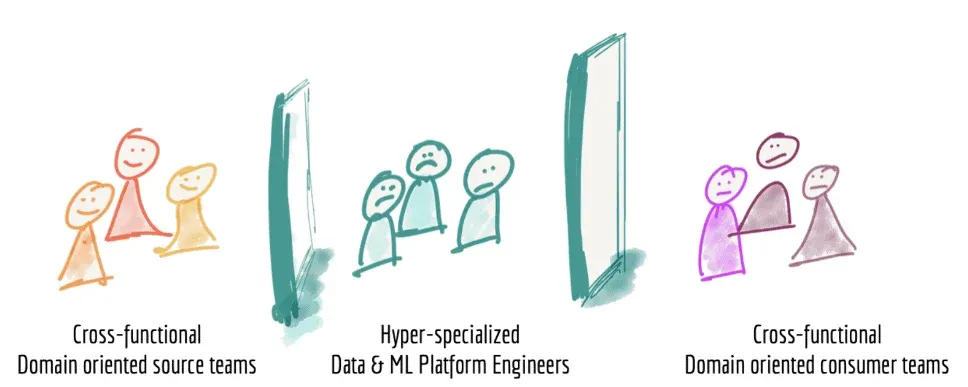
- Skill-based roles cannot rapidly respond to customer requests – Imagine a project where different parts are written in Java, Scala, and Python. Not everyone has all these skills, so there are bound to be bottlenecks centering on certain people. Data professionals are not perfectly interchangeable. Further, the teams of specialized data engineers who build and maintain enterprise data platforms operate as a centralized unit divorced from the business units that create and consume the data. The communication between business units and data professionals is usually incomplete and inconsistent. Centralized enterprise data architectures are not built to support Agile development. Data teams have great difficulty responding to user requests in reasonable time frames. Figure 1 above shows the barriers between data source teams, the platform team and data consumers.
- Data domain knowledge matters – The data team translates high-level requirements from users and stakeholders into a data architecture that produces meaningful and accurate analytics. This is much easier to do when the data team has intimate knowledge of the data being consumed and how it applies to specific business use cases. A schema designer who moves from project to project may not understand the nuances behind the requirements of each data consumer.
- Universal, one size fits all patterns fail – Data teams may fall into the trap of assuming that one overarching pattern can cover every use case. We’ve seen many data and analytic projects, and mistaken assumptions like this one are a common cause of project underperformance or failure.
Introduction to Data Mesh
The data mesh addresses the problems characteristic of large, complex, monolithic data architectures by dividing the system into discrete domains that are managed by smaller, cross functional teams. Data mesh proponents borrow the term “domain” from the software engineering concept of “domain-driven design (DDD),” a term coined by Eric Evans. DDD divides a system or model into smaller subsystems called domains. Each domain is an independently deployable cluster of related microservices which communicate with users or other domains through modular interfaces. Each domain has an important job to do and a dedicated team – five to nine members – who develop an intimate knowledge of data sources, data consumers and functional nuances. The domain includes data, code, workflows, a team, and a technical environment. Data mesh applies DDD principles, proven in software development, to data analytics. If you’ve been following DataKitchen at all, you know we are all about transferring software development methods to data analytics. The concept of data mesh, proposed by Zhamak Dehghani, has taken the industry by storm. We’d like to add a discussion of how data mesh lifecycle management requires DataOps.
Below we’ll look at an example of a data architecture partitioned into domains to illustrate data mesh.
You may have used a media streaming application such as Spotify or SoundCloud. A streaming service has to handle a variety of activities that logically partition into different areas:
- Artists – onboard, pay, manage, …
- Podcasts – create, release, play, …
- Users – register, manage profiles, manage access, …
A centralized enterprise application would combine all of these functions and services into one monolithic architecture. A data mesh tackles each functional domain as a separate set of services. In figure 2 below, three domains are shown. A dedicated team handles artists, podcasts and users respectively, but each domain depends on data and services from other domains and operational systems. The domains in the figure are shown receiving data from input data ports (IDP) and transmitting data to output data ports (ODP). The act of onboarding a new artist activates an artist onboarding service that updates the artists domain. Perhaps when a user plays a podcast (within the podcast domain) it triggers an input into the artist’s domain, which activates the artist payment service.
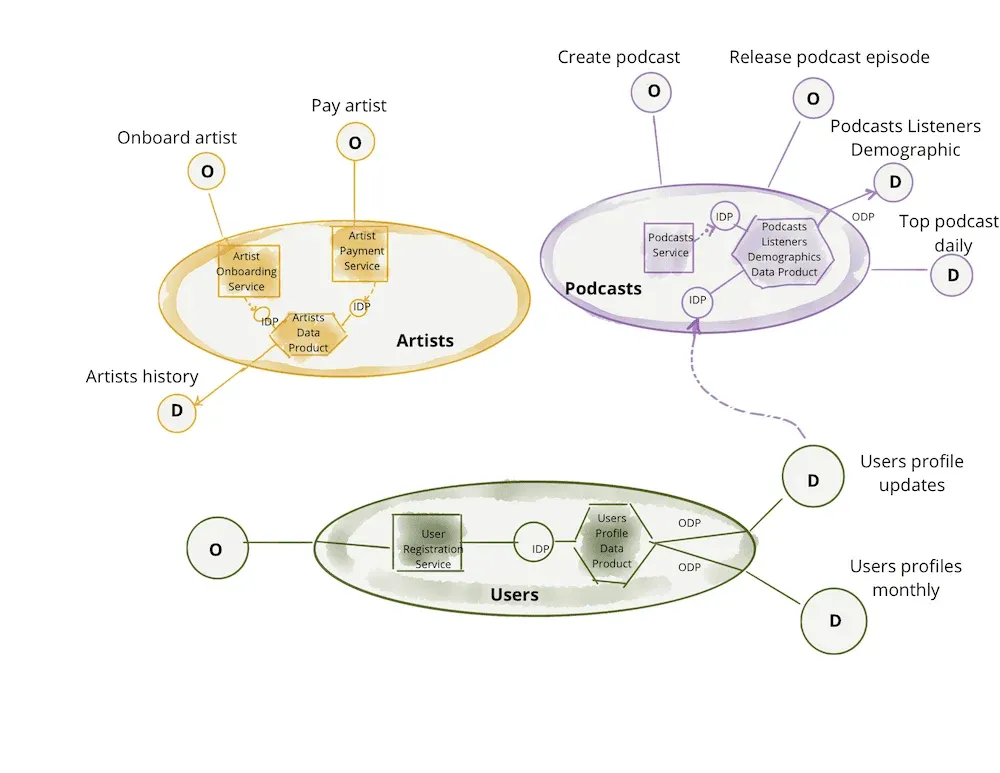
Application scalability improves as each group independently manages its domain. For example, the users domain team could add a new data set or new microservices related to users data with complete autonomy.
Data Mesh Versus Data Fabric
In computer architecture, a fabric can be a mesh, so naturally some industry experts have had trouble wrapping their heads around the difference between a data mesh and a data fabric. We’ve written about data fabrics at length and can testify that data fabrics and data mesh are very different concepts. Like data virtualization, data fabrics focus on harmonizing the diverse technologies and tools that comprise an enterprise data architecture. A data fabric endeavors to unify an enterprise’s technical environment into a coherent data platform. That capability can be quite useful for a data mesh.
A data mesh focuses on restructuring the data organization utilizing small teams that each assume ownership and responsibility for a subsystem or discrete domain of the enterprise data architecture. With greater autonomy and focus, teams can leverage composable infrastructure to operate in a more Agile and decentralized fashion. For a lengthy discussion of how system designs tend to mirror an organization’s structure, see our piece on “Conway’s Law.” As an organizing principle for teams and architectures, the data mesh doesn’t necessarily require specific tools, but the domain team will face tremendous challenges unless backed by DataOps automation. In summary, data mesh and data fabric are distinct design patterns. You can have one without the other.
Centralization Versus Freedom in Analytics
In data analytics, there is a constant tension between centralization and decentralization. We like data democratization and self-service analytics because it empowers innovation, but the enterprise must adhere to strict governance standards. We need one version of reality, but centralizing analytics creates bottlenecks. DataOps resolves this struggle between centralization and freedom by organizing and automating workflows and pipelines. A DataOps superstructure can play a foundational role in enabling a data mesh to mitigate issues related to the over-centralization or over-decentralization of data analytics.
Improve Agility with a Data Mesh
One difficulty of large, centralized enterprise architectures is that they don’t lend themselves to using Agile methods. The centralized architecture consists of myriad pipelines that ingest, process and serve data. Everyone on the data team works on their specialized part of the larger system, and they rely upon emails, documents and meetings to stay organized. Figure 3 shows the strained lines of communications that cross functional boundaries. Roles tend to be more specialized on a big team, so there are bottlenecks. With heavyweight processes, it becomes much more bureaucratic to make a change to any part of the architecture. With a steady stream of requests for new data sources and new analytics, the centralized team managing the platform can quickly exceed their capacity to keep up. Customers are on a journey to get insight, and they may not know exactly what they want until they see it. With large systems, it’s much harder to iterate toward a solution that addresses a user’s latent requirements.
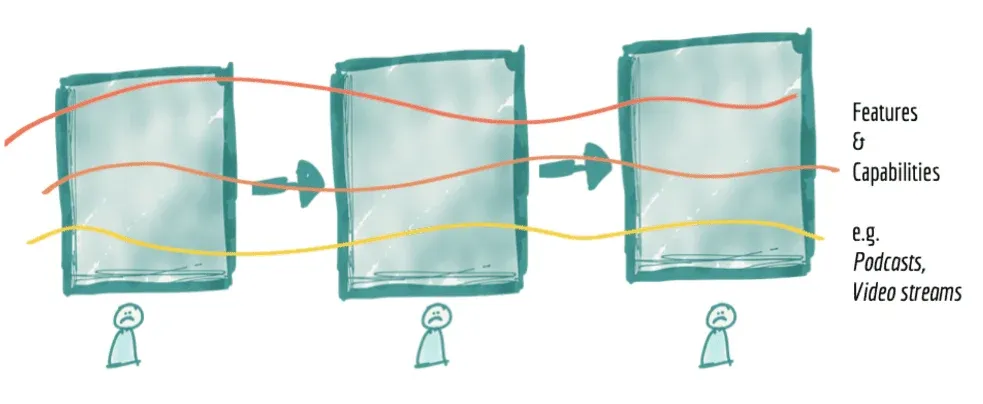
Data mesh decouples the domain teams from each other. By partitioning the system into pieces, each domain team is able to work uninterrupted and at their natural iteration cadence. Over time, domain teams attain a much more intimate understanding of their data sources and uses, leading to more effective technical solutions. The data team addresses the backlog of tasks more quickly because task coordination is simpler with a smaller team. The data mesh team assumes total lifecycle ownership of the domain.
The domain is their internal “product” and the domain product manager is their empowered mini-CEO. You may have heard the term “product thinking” with respect to a data mesh. Success means excellently serving the needs of internal customers. Team members cover all the roles, so there are more hybrid players enabling more flexibility in responding to surges in demand for a particular skill set. When something goes wrong, the domain team has all of the right incentives to iterate on a solution.
The organizational concepts behind data mesh that we have covered are summarized as follows.
- Five to nine-person team owns the dev, test, deployment, monitoring and maintenance of a domain.
- The team organizes around the domain, not the underlying toolchain or horizontal data pipelines.
- Domain data assets, artifacts and related services are viewed as the team’s product. The product includes data and operations. Data consumers are the domain team’s customers.
- Data Engineers must develop an intimate understanding of data sets to really add value.
Technical Side of Data Mesh
We’ve talked about data mesh in organizational terms and how team structure supports agility. Let’s take a deeper look at the technical side of data mesh before we provide an application example.
The data industry has a wide variety of approaches and philosophies for managing data: Inman data factory, Kimball methodology, star schema, or the data vault pattern, which can be a great way to store and organize raw data, and more. Data mesh does not replace or require any of these.
The data mesh is focused on building trust in data and promoting the use of data by business users who can benefit from it. In essence, a domain is an integrated data set and a set of views, reports, dashboards, and artifacts created from the data. The domain also includes code that acts upon the data including tools, pipelines, and other artifacts that drive analytics execution. The domain requires a team that creates/updates/runs the domain, and we can’t forget metadata: catalogs, lineage, test results, processing history, etc, …
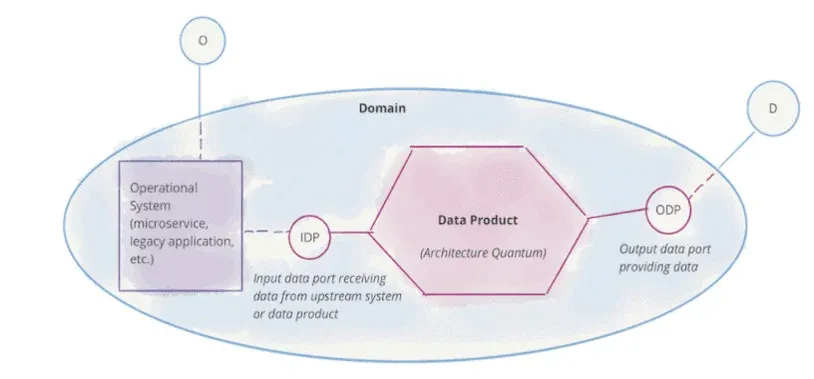
Instead of having a giant, unwieldy data lake, the data mesh breaks up the data and workflow assets into controllable and composable domains with inherent interdependencies. Some domains are built from raw data. Other domains are built from raw data and the output of other domains. Figure 4 below shows a simplified diagram of a domain receiving input data from an upstream source like an operational system (O) and supplying data (D) to a customer or consumer.
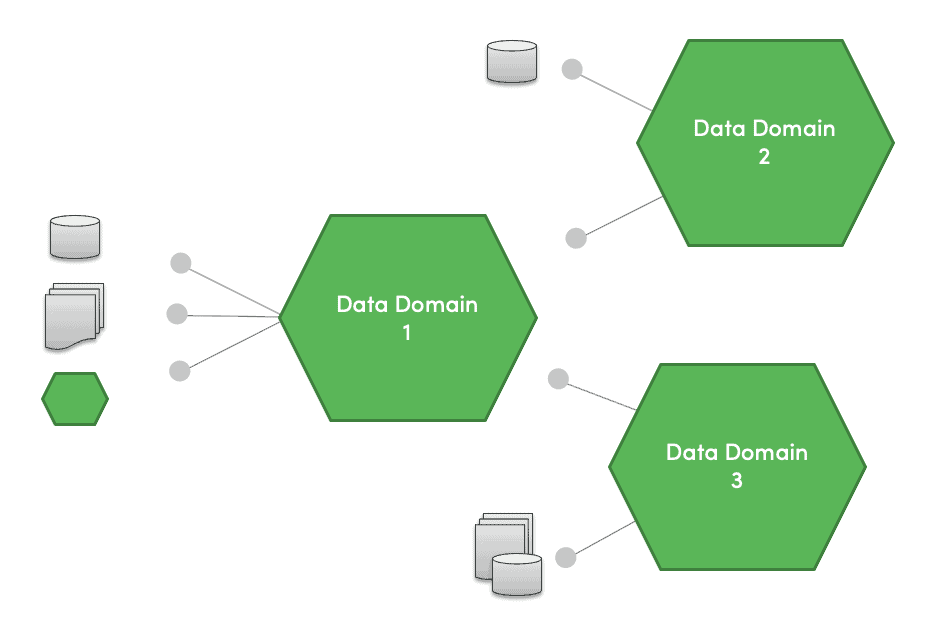
There’s a clear order-of-operations challenge in building systems based on interdependent domains. For example, in the domain diagram in Figure 5 below, imagine that domain 1 has a list of mastered customers, which is utilized by domains 2 and 3. There’s an implied producer-consumer, order of operations relationship between these two. It’s also very important to make domains composable and controllable.
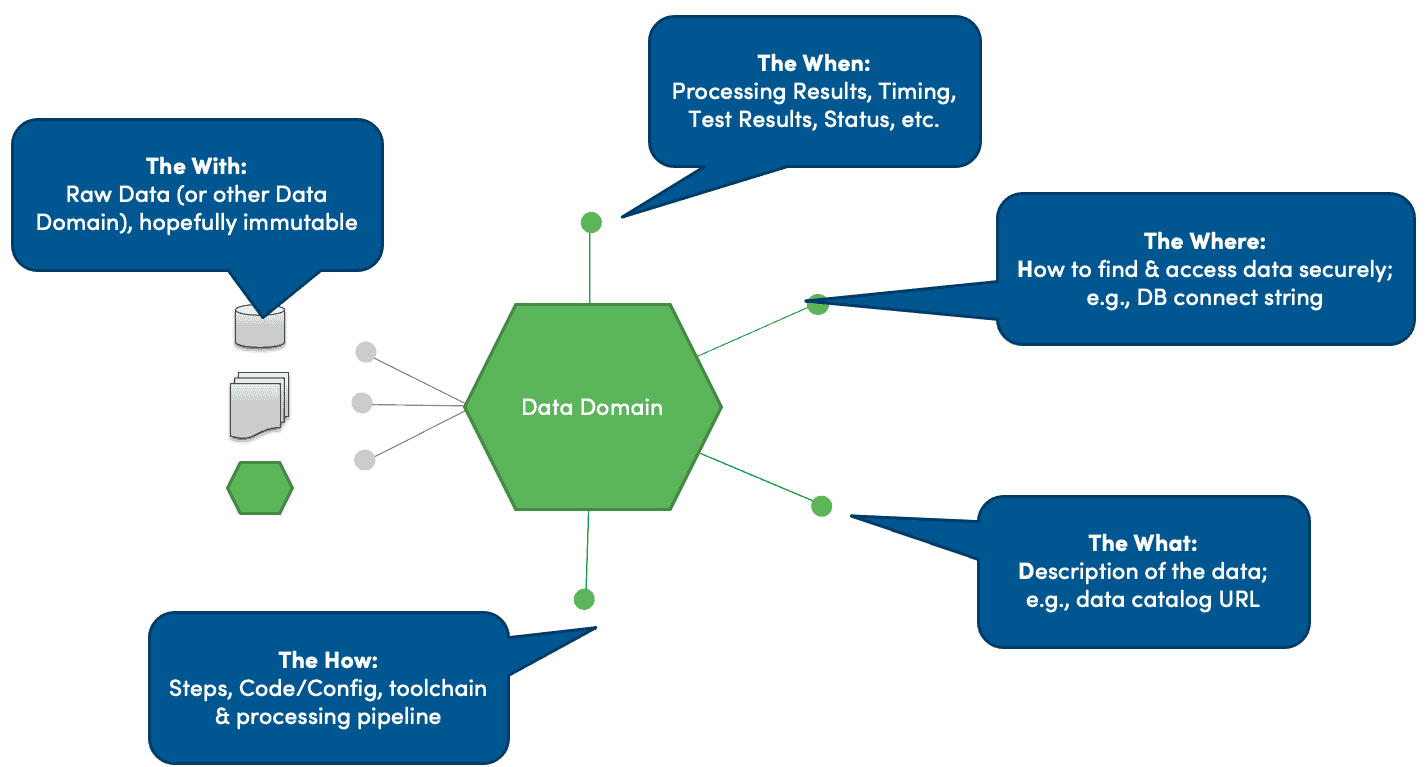
The consumers and customers of a domain can look at it as a black box. They don’t have to think about the domain’s internal complexity. The domain is accessed through its external interfaces which can be easily remembered as the four “W’s” and an “H:”
- What is in the domain – description of the data, e.g., data catalog URL
- Where is the data – how to find and access the data securely, e.g., DB connect string
- When was the domain created/tested – data process lineage including artifacts like processing results, timing, test results, status, logs, etc., …
- With what components was the domain created, set of raw data (or other data domain) used, hopefully immutable
- How was the domain created – steps, code/configuration, toolchain, and processing pipeline used to build the data
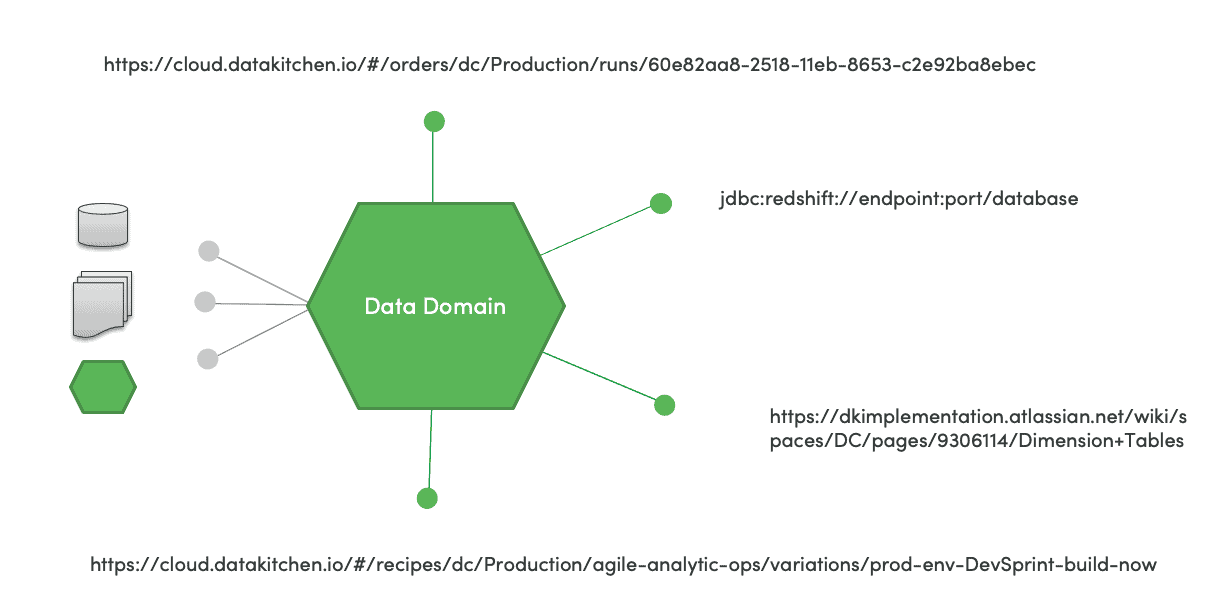
It’s convenient to publish a set of URLs that provide access to domain-related data and services. How does one get access to a domain? How does one edit the catalog? How does a customer get status? Where is the source code that was used? A published set of URLs that access domains allow your team to better collaborate and coordinate. Figure 7 shows a domain with associated URLs that access key tools and orchestrations.
Benefits of a Domain
A well-implemented domain has certain attributes that offer benefits to the customers or domain users:
- Trusted – Users wish to be confident that the data and artifacts are correct. Trust must be earned, which is why it is so important for a domain to have interfaces that enable introspection and access. Users should be able to ask the domain questions and get answers.
- Usable by the teams’ customers – Customer experience improves by virtue of having a dedicated team that attains intimate knowledge of the data and its use cases. Also, the domain must support the attributes that are part of every modern data architecture.
- Discoverable – users have access to a catalog or metadata management tool which renders the domain discoverable and accessible.
- Understandable and well-described – terms are defined in a dictionary and the domain has clean, well-designed interfaces.
- Secure and permissioned – data is protected from unauthorized users.
- Governed – designed with data quality and management workflows that empower data usage.
- URL/API Driven – can easily interoperate with other domains through a hyperlink (URL) or application programming interface (API).
- Clear accountability – users interact with a responsive, dedicated team that is accountable to them.
- Easy to report problems and receive updates on fixes.
- Users may request new insights/improvements and get them into production quickly.
Organizing a data architecture into domains is a first-order decision that drives organizational structure, incentives and workflows that influence how data consumers use data. Domains change the focus from the data itself to the use cases for the data. The customer use cases in turn drive the domain team to focus on services, service level agreements (SLA) and APIs. Domains promote data decentralization. Instead of relying on a centralized team, where the fungibility of human resources is an endless challenge, the domain team is dedicated and focused on a specific set of problems and data sets. Decentralization promotes creativity and empowerment. In the software industry, there’s an adage, “you build it, you run it.” Clear ownership and accountability keep the data teams focused on making their customers successful. As an organizing principle, domains favor a decentralized ecosystem of interdependent data products versus a centralized data lake or data warehouse with all its inherent bottlenecks.
Data Mesh in a Real-World Pharmaceutical Application
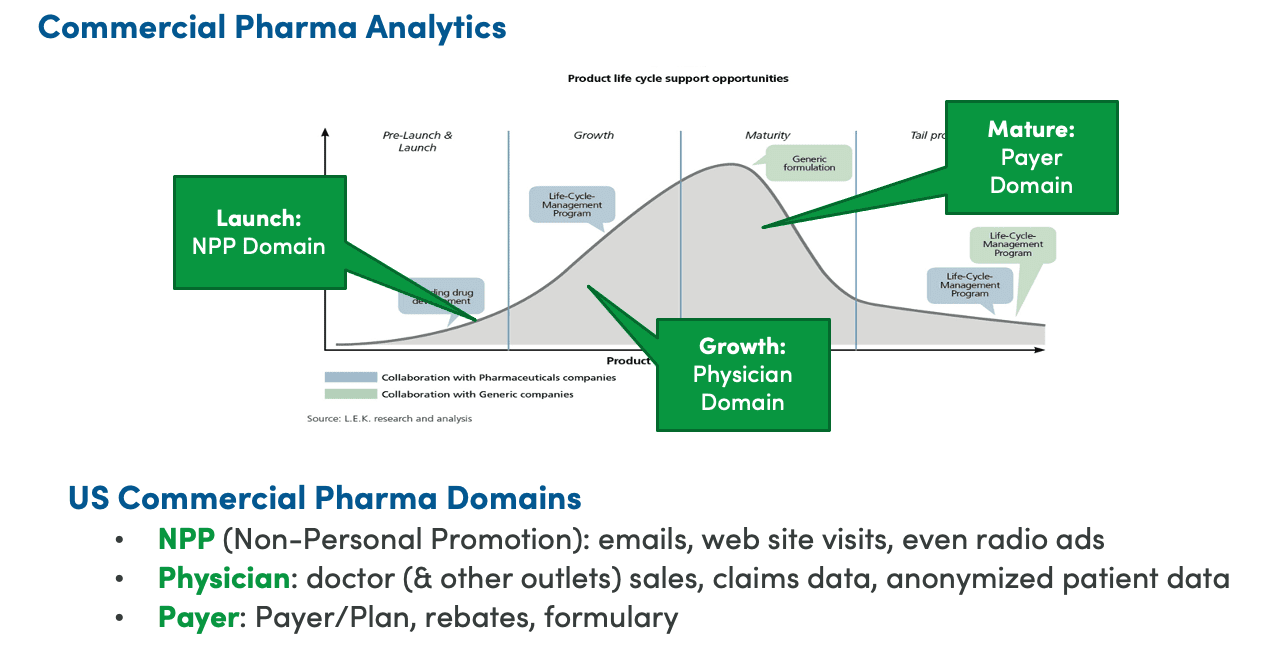
For those embarking on the data mesh journey, it may be helpful for us to discuss a real-world example and the lessons learned from an actual data mesh implementation. Some of our senior staff have extensive experience using the data mesh design pattern with pharmaceutical company data. In the United States, private manufacturers of pharmaceuticals receive a patent for a limited period of time – approximately 20 years. In figure 8 below, we see that the data requirements are quite different for each of three critical phases of a drug’s lifecycle:
| Lifecycle Phase | Marketing Target | Data Focus |
|---|---|---|
| Launch | Patients | Non-Personal Promotion: emails, website visits, even radio ads |
| Growth | Physicians | Sales, claims data, anonymized patient data |
| Mature | Payer / Insurance Co | Rebates, formulary |
Table 1: Lifecycle phases of pharmaceutical product launch
Each distinct phase of the drug lifecycle requires a unique focus for analytics. During the launch phase, the focus is on marketing to patients through consumer channels. A successful launch lays the groundwork for the growth phase where physicians prescribe the drug (the manufacturer hopes). As generic alternatives become available, the market passes through the maturity phase where cost efficiency and margins become paramount. There are different teams within the pharmaceutical company that focus on the respective target markets.
Drug companies maintain internal data sets, but also rely heavily upon third-party data (a multi-billion dollar industry). Some data sets are used by multiple teams, but that introduces complexity. Figure 9 shows the wide array of data sets used by pharmaceutical product launch organizations.
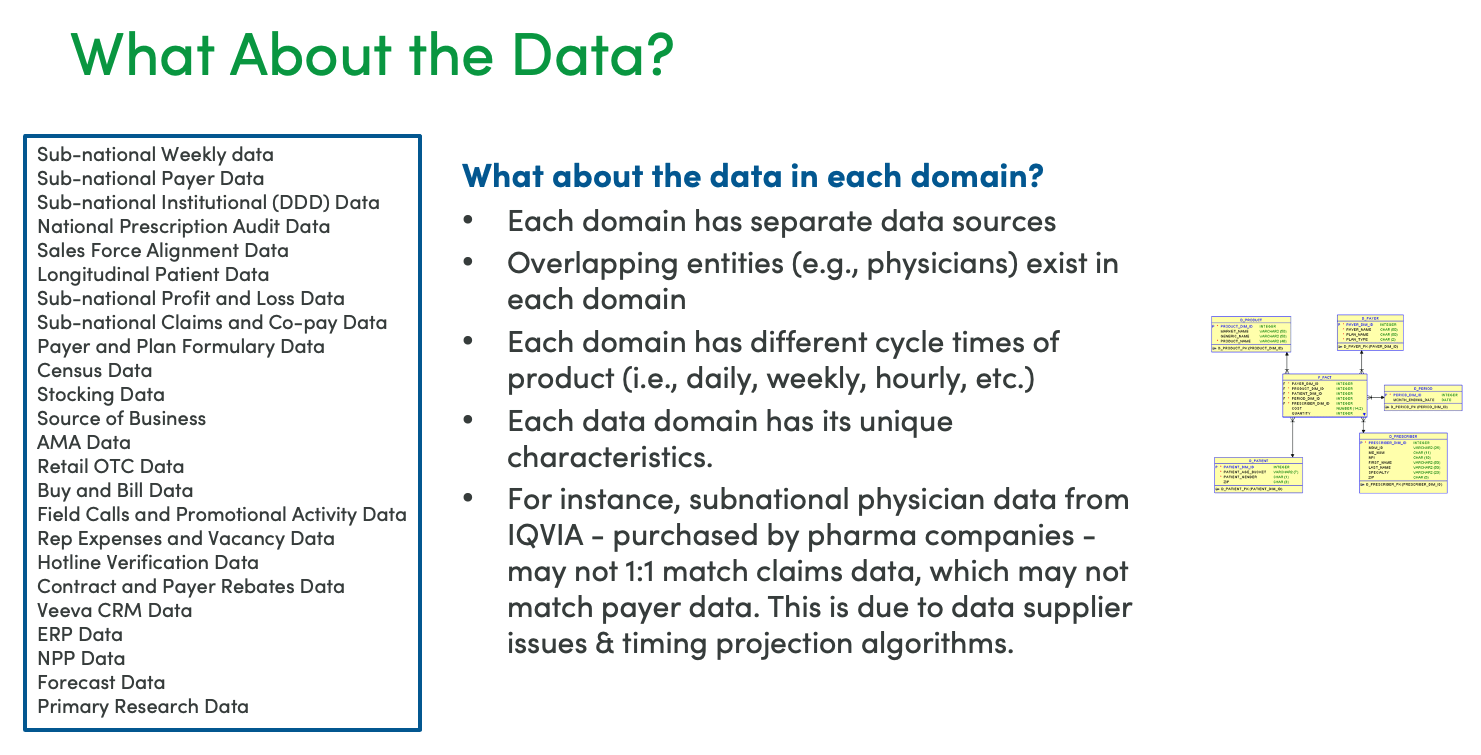
Some data sets are a mix of actual and projected data, complicating their use with other data sets that purport to be the same thing, but use a different algorithm to fill in gaps or projections. Two data sets of physicians may not match. They each tell a different story about the data.
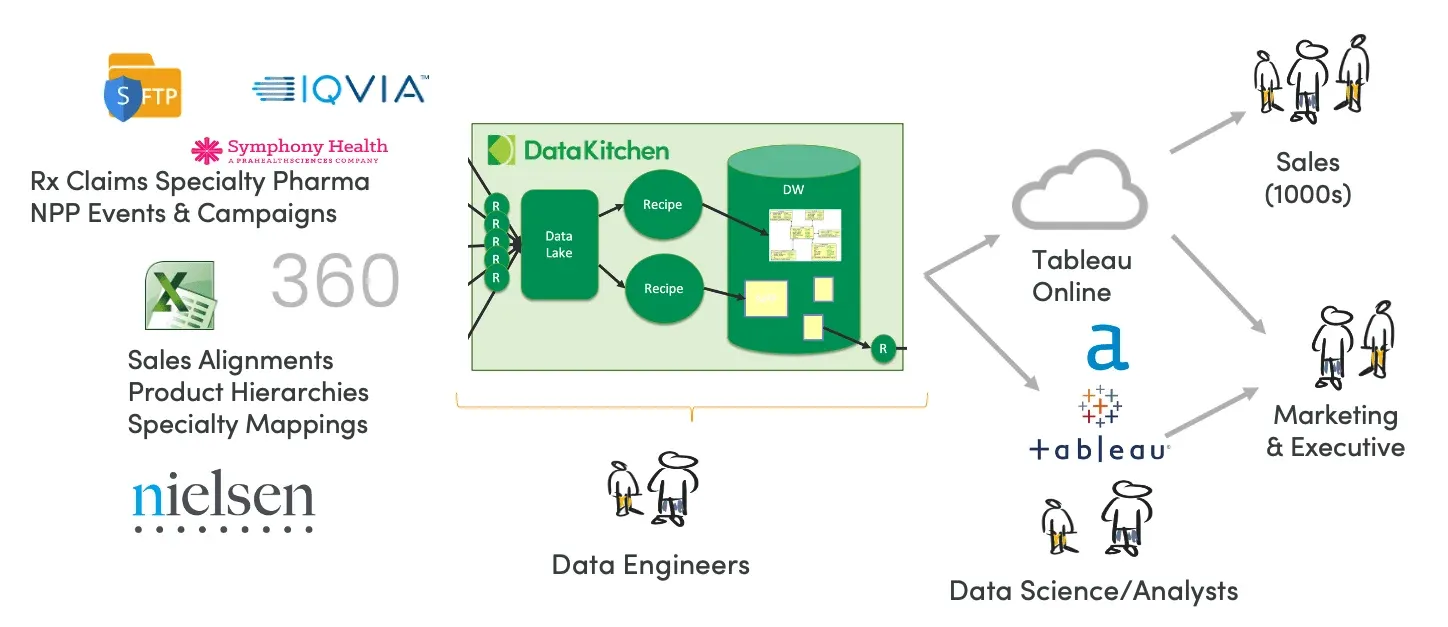
Figure 10 shows an example processing architecture with data flowing in from internal and external sources. Each data source is updated on its own schedule, for example daily, weekly or monthly. DataKitchen DataOps Automation ingests data into a data lake and runs recipes to create a data warehouse that is leveraged by users and self-service data analysts. These users are very important to the company because their success greatly influences the strength of the revenue ramp in the drug’s growth and maturity phases.
Let’s consider how to break up our architecture into data mesh domains. In figure 11 we see our raw data shown on the left. First, the data is mastered, usually by a centralized data engineering team or IT. Each of the mastered data sets could be a domain. For example, there may be one million physicians in the US, but for a given drug, perhaps only 40,000 are important. Getting this standardized is important because it affects sales compensation.
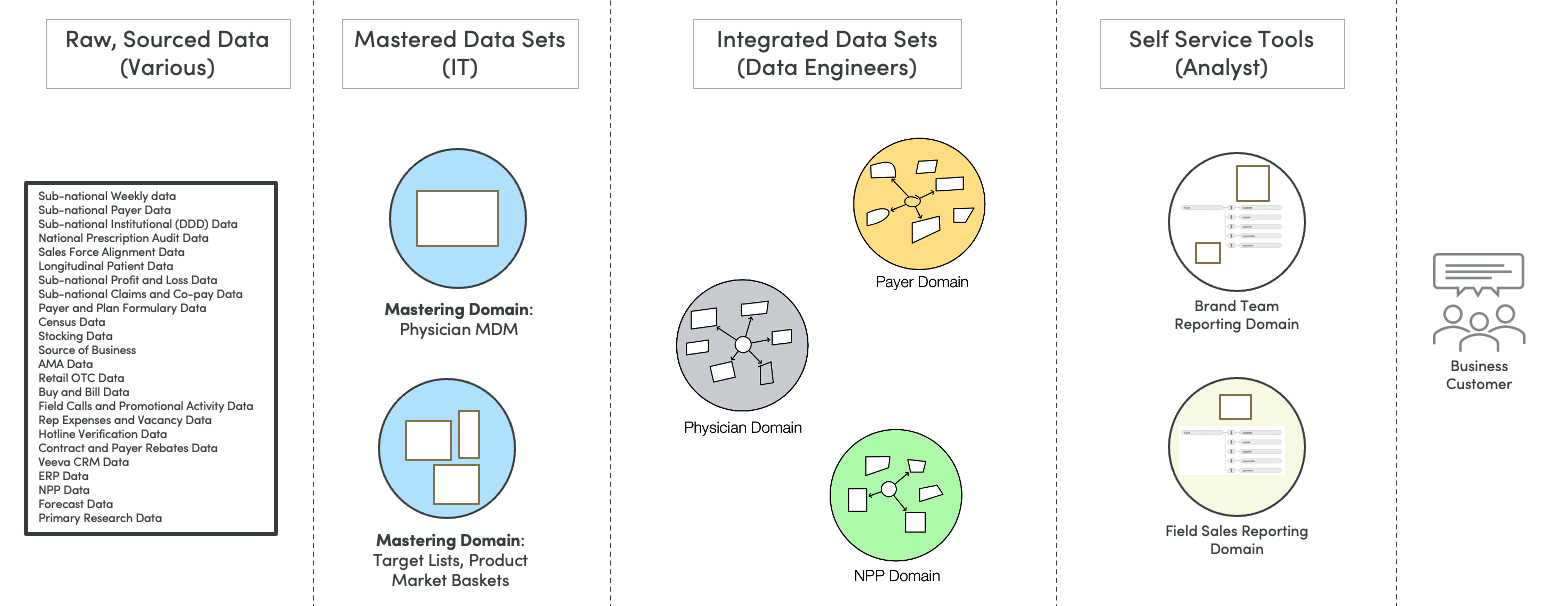
The second set of domains are the integrated data sets created by data engineers in the form of data warehouses or analytic data marts. There are facts and dimensions, along with multiple tables, used to answer business questions that come up. In many cases, these are star schemas.
The third set of domains are cached data sets (e.g., tableau extract) or small data sets that self-service analysts can mix with the central data in Alteryx or other tools. Self-service data science teams may require their own segmentation models for building reports, views, and PowerPoints.
Each circle in the figure above could be its own data mesh domain. The separation of these data sets enables the teams to decouple their timing from each other.
In figure 12 below, we see that each domain has its own domain update processing (recipes or data analytics pipelines), represented by a directed-acyclic graph (DAG). For each domain, one would want to know that a build was completed, that tests were applied and passed, and that data flowing through the system is correct.
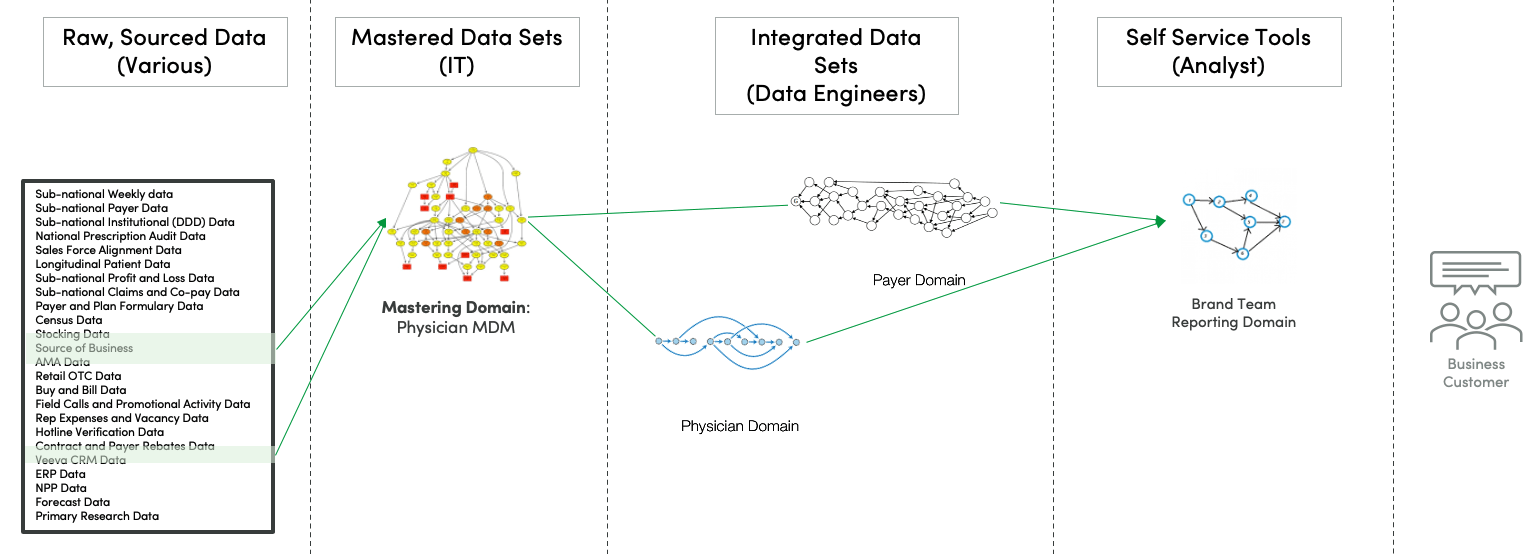
There’s a top-level DAG relationship between the raw data, arriving asynchronously, the mastered domain, the integrated data sets and the self-service domain. One challenge is that each domain team can choose a different toolset that complicates multi-level orchestration, testing and monitoring. A DataOps superstructure that supports connectors to data ecosystem tools addresses this issue.
Another challenge is how to manage ordered data dependencies. The American Medical Association (AMA) may update its data set of physicians which flows into the physician mastered domain. It then gets used by the physician and payer data warehouses which are eventually used by the self-service teams. We don’t want the physician data set in the physician domain and the payer domain to drift apart or get “out of sync,” which might happen if they are updated on different iteration cadences. While the goal of a data mesh is to empower teams through decentralization, the overall architecture has to consider the order-of-operations dependencies between the domains. If not intuitively obvious, this is incredibly hard and a major cause of unhappy users.
To manage complexity, the system requires inter-domain communication shown in the table below. A domain query provides information about builds, data, artifacts, and test results. Process linkage aids in multi-level DAG orchestration. Some designs perform process linkage with an event bus that perhaps marks the completion of a DAG by putting an event on a Kafka queue and using a publish/subscribe model. Data linkage refers to the sharing of common tables or the output of data from one domain being fed into another. Finally, there is development linkage. Can development environments with all related domains be created easily? Can they be modified? Is there a seamless path to production?
The many ports or access points of inter-domain communication further illustrate why it’s so helpful to support URL-based queries. It enables the data engineer to ask questions, parse responses and set up automated orchestrations, instead of maintaining checklists and manual procedures that someone must execute.
We see a DataOps superstructure like DataKitchen DataOps Automation playing a central supporting role in the successful implementation of a data mesh. DataOps excels at the type of workflow automation that is able to coordinate interdependent domains, manage order-of-operations issues and handle inter-domain communication. The next section will explore the DataOps-enabled data mesh in more depth.
| Inter-Domain Communication | Question / Steps Asked |
|---|---|
| Domain Query | ”When was the last time you were updated? Successful or failure? Warnings?" "Is the data or artifacts in your domain good?" "Can you prove it with some test results?” |
| Process Linkage | ”Ok, you start. I am done." "Ok, you start. I am done AND here are a bunch of parameters you need to keep going.” |
| Event Linkage | ”Here is an event: e.g., processing completed, error, warnings, etc.” |
| Data Linkage | ”We share a common table (e.g., a dimension table) in our domain.” |
| Development Linkage | ”Can I re-create your domain in development?" "Can I see the code you used to create it?" "Can I modify that code in development?" "Is there a path to production?” |
Table 2: Inter-Domain Communication
DataOps and the Data Mesh
DataOps focuses on automating data analytics workflows to enable rapid innovation with low error rates. It also engenders collaboration across complex sets of people, technology, and environments. DataOps produces clear measurement and monitoring of the end-to-end analytics pipelines starting with data sources. Whereas data mesh talks about architecture and team alignment, DataOps automates workflows that simplify data mesh development and operations. A data mesh implemented on a DataOps superstructure, like DataKitchen DataOps Automation, has a much greater chance of success. One can implement DataOps on its own without data mesh, but data mesh is a powerful organizing principle for architecture design and a great fit for DataOps-enabled organizations. DataOps is the scaffolding and connective tissue that helps you construct and connect a data mesh.
A discussion of DataOps moves the focus away from organization and domains and considers one of the most important questions facing data organizations – a question that almost never gets asked. “How do you build the factory that makes the machines?” The data factory takes inputs in the form of raw data and produces outputs in the form of charts, graphs and views. Before you can run your data factory, you have to build your data factory. Before you build your factory, you would do well to design mechanisms that create and manage your data factory.
Architecture, uptime, response time, key performance parameters – these are challenging problems and so they tend to take up all the oxygen in the room. Take a wider view. Architect your data factory so that your data scientists lead the industry in cycle time. Design your data analytics workflows with tests at every stage of processing so that errors are virtually zero in number. Doing so will give you the agility that your data organization needs in order to cope with new analytics requirements. Agile analytics will help your data teams realize the full benefits of an application and data architecture divided into domains.
Efficient workflows are an essential component of a successful data team initiative. One common problem is that code changes or new data sets may break existing code. Your domain DAG is ingesting data, and then transforming, modeling and visualizing it. It’s hard enough to test within a single domain, but imagine testing in relation to other domains which use different teams and toolchains, managed in other locations. How do you allow a local change to a domain without sacrificing global governance and control? That’s important to do, not only within a single domain but between a group of interdependent domains as well.
With a DataOps superstructure, like DataKitchen DataOps Automation, you are testing each step in your DAG on whatever infrastructure and tools the domain is using. DataKitchen supports an intelligent, test-informed, system-wide production orchestration (meta-orchestration) that spans toolchains. Unlike orchestration tools like Airflow, Azure Data Factory or Control-M, DataKitchen can natively connect to the complex chain of data engineering, science, analytics, self-service, governance and database tools, and meta-orchestrates a hierarchy of DAGs. Meta-orchestration in a heterogeneous tools world is a critical component to successfully rolling out a data mesh.
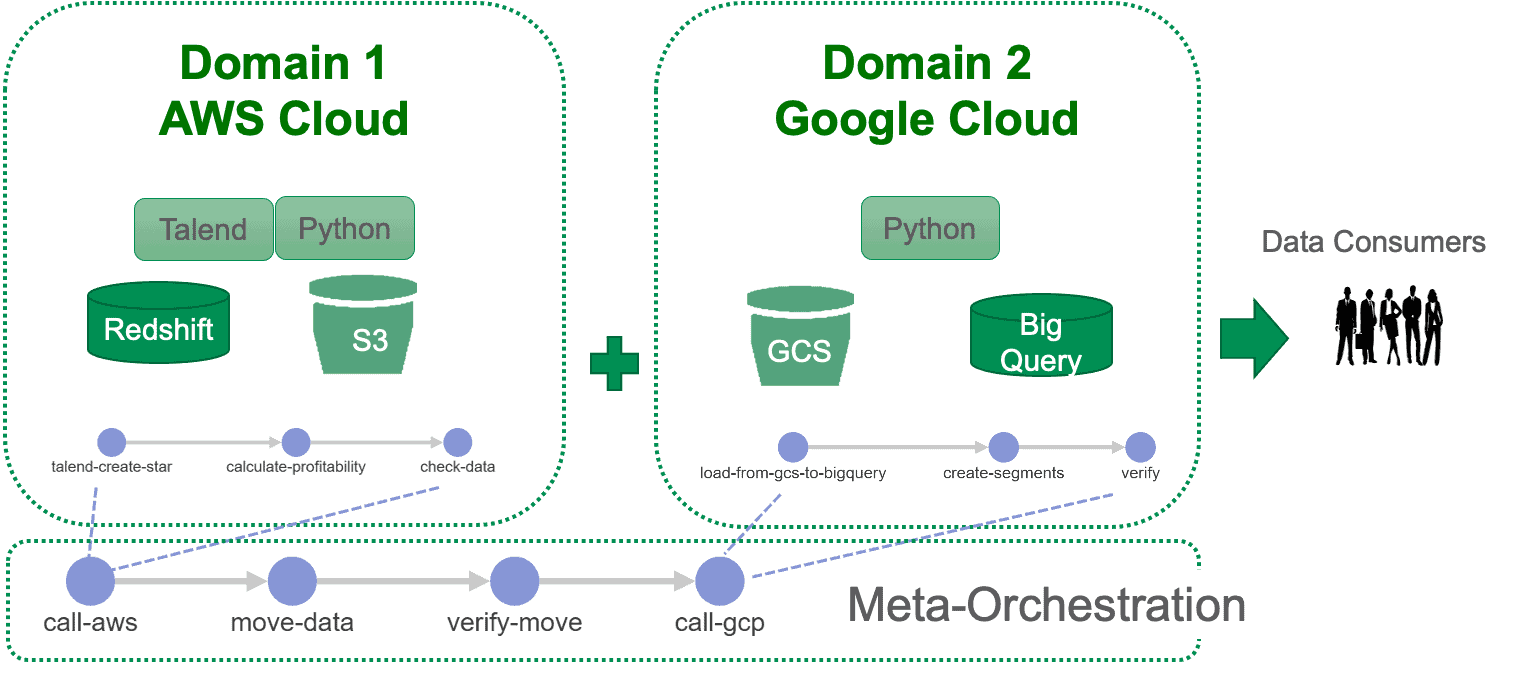
DataKitchen DataOps Automation natively provides URL access to nearly all the interfaces that are required for inter-domain communication.
| Inter-Domain Communication | Question / Steps Asked | DataKitchen Support |
|---|---|---|
| Domain Query | ”When was the last time you were updated?" "Successful or failure? Warnings?" "Is the data or artifacts in your domain good?" "Can you prove it with some test results?” | Yes |
| Process Linkage | ”Ok, you start. I am done." "Ok, you start. I am done and here are a bunch of parameters you need to keep going.” | Yes |
| Event Linkage | ”Here is an event: e.g., processing completed, error, warnings, etc.” | Yes |
| Data Linkage | ”We share a common table (e.g., a dimension table) in our domain.” | Link to 3rd Party Tools |
| Development Linkage | ”Can I re-create your domain in development?" "Can I see the code you used to create it?" "Can I modify that code in development?" "Is there a path to production?” | Yes |
Table 3: DataKitchen DataOps Automation support for inter-domain communication
The capability to execute domain queries comes from DataKitchen order runs. Process queries come from calling an order run or running a recipe (orchestration pipeline). Event linkage is natively supported and development linkage stems from Kitchens (on-demand development sandboxes). DataKitchen supports data linkage by integrating with tools that access and store data – there are plenty of great ones.
DataKitchen groups recipes into components called ingredients. Ingredients are composable units that can enable domains to change independently. They can also be orchestrated together within Kitchens.
DataKitchen can help you address the important tasks of how to develop, deploy, and monitor analytics related to a domain.
- Recipes – Orchestrate the whole pipeline (i.e., ingest, process/curate, serve, etc.) inside of a domain. DataKitchen Recipes can serve as a master DAG as well as lower-level DAGs nested inside other DAGs.
- Monitoring Tests – Make sure the data (from suppliers and to customers) is trustworthy. This aids in diagnostics (i.e., detection and localization of an issue). In the DataKitchen context, monitoring and functional tests use the same code.
- Variations – Execute data pipelines with specific parameters. Deliver the correct data product for the consumer, because one size does not fit all. Variations enable the data team to create different versions of their domain to handle development, production, “canary” versions or any other change. Variations unlock a great degree of agility and enable people to be highly productive.
- Kitchen Wizard – Provide on demand infrastructure to the data teams to prevent delays. One concern related to domain teams is the potential duplication of effort with respect to horizontal infrastructure. DataKitchen can be used to automate shared services. For example, DataKitchen provides a mechanism to create self-service, development sandboxes so the individual teams do not have to create and support this capability.
- Kitchens/Recipes/Functional Tests – Iterate to support the “product-oriented” approach. Building the factory that creates analytics with minimal cycle time is a critical enabler for the customer focus that is essential for successful domain teams.
Conclusion
Data mesh is a powerful new paradigm which deals with the complexity in giant, monolithic data systems. As an organizing principle, it focuses on data, architecture and teams and less, the operational processes that are so important for agile, error-free analytics. As part of your data mesh strategy, DataOps assists with the process and workflow aspects of data mesh. DataOps automates shared services preventing duplication of effort among teams. DataOps also addresses some of the complexity associated with domain inter-dependencies and enables the data organization to strike the right balance between central control/governance and local domain independence.
Related Reading
This paper was also published as a five-part blog series:
- What is a Data Mesh? — part 1, the design pattern and why it emerged
- Use DataOps With Your Data Mesh to Prevent Data Mush — part 2, the cost of decentralization
- Addressing Data Mesh Technical Challenges with DataOps — part 3, meta-orchestration and composability
- Implementing a Pharma Data Mesh using DataOps — part 4, the commercial pharma example in detail
- DataOps is the Factory that Supports Your Data Mesh — part 5, building the factory
Related papers and pages:
- What Is DataOps? — the definition this paper builds on
- Connecting Your Data Mesh with DataOps — the short version of the argument
- Warring Tribes into Winning Teams — the teamwork problem a mesh reorganizes around
- Data Quality: The DataOps Way — how to prove a domain’s data is good
- DataOps Observability: Taming Chaos — how to see across every domain’s pipelines at once
- 7 Steps to Implement DataOps — the engineering practices underneath the factory
- Install DataOps TestGen — open-source data profiling and test generation, free to run on your own domain
FAQ
What is the main point of this paper?
The data mesh design pattern breaks giant, monolithic enterprise data architectures into subsystems or domains, each managed by a dedicated team. That decentralization buys agility, but it creates order-of-operations issues, inter-domain communication, and duplicated shared services. A DataOps superstructure supplies the foundation that lets a group of interdependent domains work in concert, so the mesh delivers business agility instead of chaos.
What is a data mesh?
A data mesh is a design pattern that divides a large, complex, monolithic data architecture into discrete domains managed by smaller cross-functional teams. Each domain is an independently deployable cluster of related services that communicates with users or other domains through modular interfaces. The term borrows from domain-driven design, coined by Eric Evans, and the data mesh concept was proposed by Zhamak Dehghani of Thoughtworks.
What is inside a data mesh domain?
A domain is an integrated data set plus the views, reports, dashboards, and artifacts created from it. It also includes the code that acts on the data — tools, pipelines, and other artifacts that drive analytics execution — the metadata such as catalogs, lineage, test results, and processing history, a dedicated team that creates, updates, and runs it, and a technical environment.
How large should a data mesh domain team be?
Five to nine people. A team that size owns the development, test, deployment, monitoring, and maintenance of one domain, and it is large enough to vet ideas without being so large that it stifles innovation. Team members cover all the roles, so there are more hybrid players and more flexibility when demand surges for a particular skill set.
What is the difference between a data mesh and a data fabric?
They are distinct design patterns and you can have one without the other. A data fabric focuses on harmonizing the diverse technologies and tools that make up an enterprise data architecture, unifying the technical environment into a coherent platform. A data mesh focuses on restructuring the data organization into small teams that each own a discrete domain. A fabric can be quite useful to a mesh.
What are the four W’s and an H of a domain?
They are the external interfaces a domain exposes so consumers can treat it as a black box. What is in the domain — a description of the data, such as a catalog URL. Where the data is — how to find and access it securely, such as a database connect string. When the domain was created and tested. With what components it was created. And how it was created: steps, code, toolchain, and pipeline.
Why publish domain interfaces as URLs?
A published set of URLs answers the recurring questions — how do I get access, how do I edit the catalog, how does a customer get status, where is the source code — without a meeting. URL-based queries let a data engineer ask questions, parse the responses, and set up automated orchestrations, instead of maintaining checklists and manual procedures that someone must remember to execute.
What kinds of inter-domain communication does a data mesh need?
Five. Domain query asks when a domain was last updated, whether the run succeeded, and whether the data can be proven good with test results. Process linkage passes control and parameters between pipelines. Event linkage announces completions, errors, and warnings. Data linkage covers shared tables and data flowing from one domain into another. Development linkage covers recreating, inspecting, and modifying a domain in development.
What is the order-of-operations problem in a data mesh?
Domains depend on each other, so an update to one has to reach the others in the right sequence. If domain 1 masters a list of customers used by domains 2 and 3, there is an implied producer-consumer relationship. When the American Medical Association refreshes its physician data, the physician and payer warehouses that consume it can drift out of sync if they run on different iteration cadences. That drift is a major cause of unhappy users.
How does the pharmaceutical example break into domains?
Three layers. Mastered data sets, usually produced by a centralized data engineering team or IT, such as physician master data management. Integrated data sets built by data engineers as warehouses or analytic data marts, often star schemas. And cached or small data sets that self-service analysts mix with central data in tools like Tableau extracts or Alteryx. Each circle in that partitioning could be its own domain.
Why does a drug’s lifecycle phase change the analytics?
Because each phase targets a different market with different data. Launch markets to patients through non-personal promotion — emails, website visits, even radio ads. Growth targets physicians and runs on sales, claims, and anonymized patient data. Maturity targets payers and insurers, where rebates and formulary decide margins. Different teams inside the company own the respective target markets, which maps naturally onto domains.
What is meta-orchestration and why does a data mesh need it?
Meta-orchestration is intelligent, test-informed, system-wide production orchestration that spans toolchains and orchestrates a hierarchy of DAGs. A data mesh needs it because each autonomous domain team can pick a different toolset, which complicates multi-level orchestration, testing, and monitoring. Unlike Airflow, Azure Data Factory, or Control-M, a DataOps superstructure connects natively to the engineering, science, analytics, self-service, governance, and database tools the domains already use.
Why does a data mesh need DataOps at all?
Data mesh is an organizing principle for data, architecture, and teams, and it says little about the operational processes that make analytics agile and error-free. DataOps automates the workflows that simplify data mesh development and operations, automates shared services so teams do not duplicate horizontal infrastructure, and handles the complexity of domain interdependencies. It is the scaffolding and connective tissue that helps you construct and connect a mesh.
What does building the factory mean?
It is the question that almost never gets asked: how do you build the factory that makes the machines? A data factory takes raw data as input and produces charts, graphs, and views as output. Before you can run the factory you have to build it, and before you build it you would do well to design the mechanisms that create and manage it. Architecture and uptime tend to take all the oxygen in the room instead.
Get the PDF
The full paper is on this page. Fill in the form for a PDF copy to keep or share.