A DataOps implementation project consists of three steps. First, you must understand the existing challenges of the data team, including the data architecture and end-to-end toolchain. Second, you must establish a definition of “done.” In DataOps, the definition of done includes more than just some working code. It considers whether a component is deployable, monitorable, maintainable, reusable, secure and adds value to the end-user or customer. The final step is designing a data solution and its implementation.
List of Challenges
A DataOps project begins with a list of challenges. Having worked with multiple customers on various use cases, scenarios and different toolchains, I believe there are commonalities in all DataOps projects. The biggest challenge is broken data pipelines due to highly manual processes. One project that I worked on involved dependencies between multiple teams and various roles. Figure 1 shows a manually executed data analytics pipeline. First, a business analyst consolidates data from some public websites, an SFTP server and some downloaded email attachments, all into Excel. She applies some calculations and forwards the file to a data engineer who loads the data into a database and runs a Talend job that performs ETL to dimensionalize the data and produce a Data Mart. The data engineer then emails the BI Team, who refreshes a Tableau dashboard.
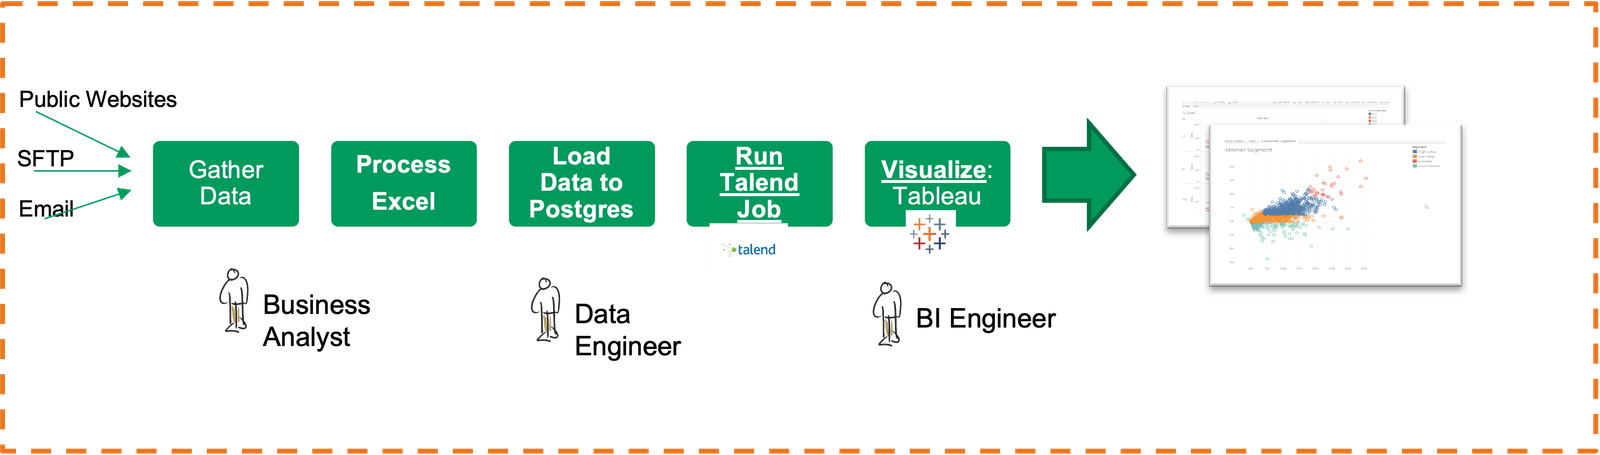
Figure 1: Example data pipeline with manual processes
There are numerous challenges with this process, as described below. There are no automated tests, so errors frequently pass through the pipeline. There are communication delays because of the multiple stakeholders belonging to different teams, each having its own priorities. The delays impact delivery of the reports to senior management, who are responsible for making business decisions based on the dashboard.
There’s a fear of making changes to the process as it might break production. There is no process to spin up an isolated dev environment to quickly add a feature, test it with actual data and deploy it to production.
The process has no monitoring whatsoever to track the actions performed by the developers, the timeline and the final output.
Definition of Done
When is a project ready to be pushed to production? When can you declare it done? Keeping DataOps principles in mind, a project is done when you can orchestrate all the tools, team environments and processes in one single pipeline, and you can manage these different environments – development, test, production, etc. All your code is version controlled in a system like GitHub, and you’re able to maintain history and track changes. The code is parameterized so that it is reusable across different environments. The DataOps pipeline you have built has enough automated tests to catch errors, and error events are tied to some form of real-time alerts.
The project is done when you can decrease the cycle time of change and quickly add and deploy a new feature. Finally, when your implementation is complete, you can track and measure your process.
DataOps Project Design and Implementation
As a DataOps implementation engineer, I transformed the use case described above into a DataOps solution – figure 2. I started by gathering all the analytic ” nuggets ” from all the teams: business rules from the business analyst, the SQL scripts from the data engineer, the Talend job from the ETL developer, and the Tableau report from the BI engineer. I quickly designed the DataOps solution to orchestrate the nuggets, tools, and environments in a single pipeline.
During implementation, my focus is to automate all the processes so that the data engineers, BI engineers and analysts can spend more time implementing new features and less time fixing errors and worrying that their processes will fail.
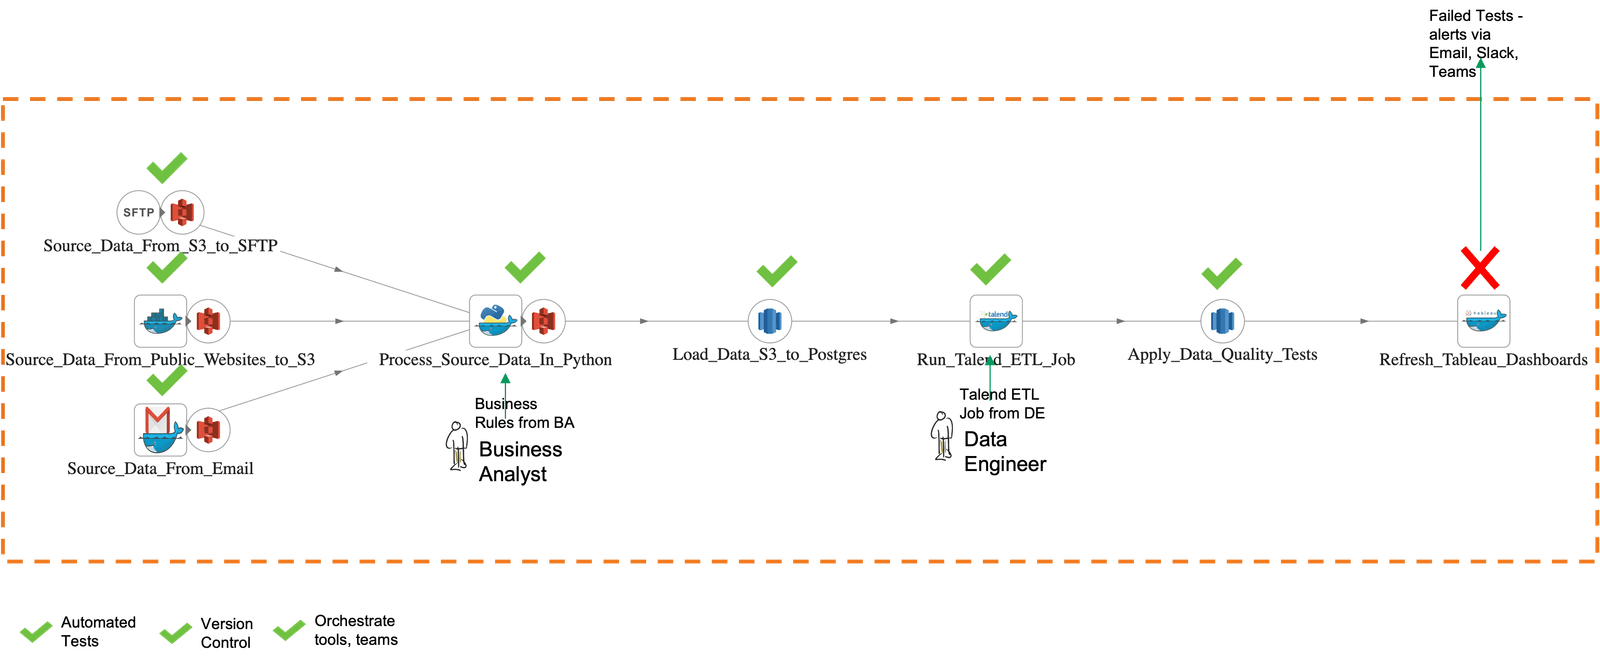
Figure 2: Example data pipeline with DataOps automation
In this project, I automated data extraction from SFTP, the public websites, and the email attachments. The automated orchestration published the data to an AWS S3 Data Lake. I use the business rules I received from the business analyst to process the source data using Python. I then orchestrated the SQL scripts, the Talend job and the Tableau dashboard refresh, all in one workflow using the APIs these tools natively provide. All the code, Talend job, and the BI report are version controlled using Git. The pipeline has automated tests at each step, making sure that each step completes successfully. Based on business rules, additional data quality tests check the dimensional model after the ETL job completes. In case of a test failure, I have alerts configured via email – you can also configure the alerts to go to Slack or Microsoft Teams or any other collaboration tool that your team uses.
Adding Tests to Reduce Stress
While implementing a DataOps solution, we make sure that the pipeline has enough automated tests to ensure data quality and reduce the fear of failure. Below is an example historical balance test. I wanted to make sure that the total number of sales orders is monotonically increasing. The test compares the current value of the total number of orders with the most recent value of the same variable – figure 3. If that number ever decreases, something is wrong. If there’s an error, I configured the pipeline to stop executing. Imagine receiving a call from your CEO because sales on the CEO dashboard were off by a million dollars. With tests, errors like these are caught before the data shows up in reports.
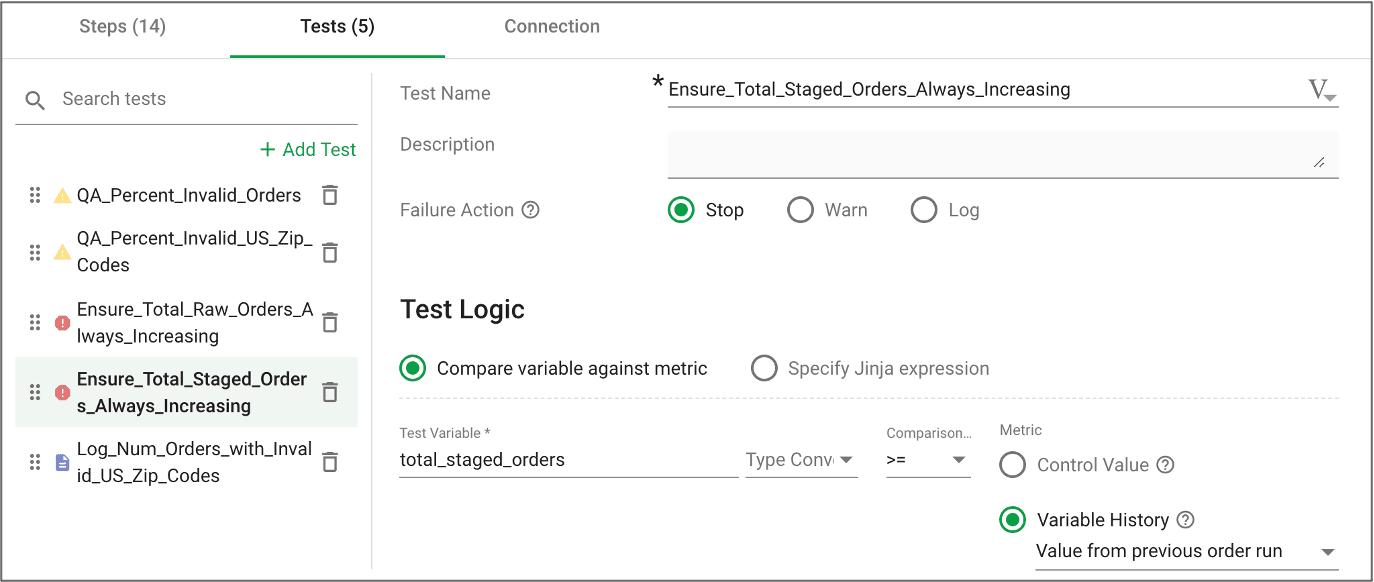
Figure 3: Example historical balance test configured to stop upon error
Below are some example DataOps tests that should be added to pipelines:
- Location Balance – make sure that the number of rows in the data matches the expected value (or threshold) at each stage in the pipeline, or make sure that if you’re moving some files, they’re not corrupted.
- Historic Balance – compares current data to previous or expected values. These tests rely upon historical values as a reference to determine whether data values are reasonable (or within the range of reasonable).
- Statistical Process Control – applies statistical methods to control a process
- Data Completeness – check for missing data
- Data Correctness – test for incorrect data
- Business Rule-Based – ensure that data matches business assumptions
These tests could be written in any language or tool. It could be SQL, a Python script or a shell script. The environment shown in my example is from the DataKitchen UI, which makes it simple to define tests even if you have no familiarity with the underlying tools executing the pipeline.
Parameterizing Code
In this solution, the SQL code and the Python code are completely parameterized to ensure reusability. Parameterization makes it possible to deploy the code across environments without any changes. For example, the SQL code in figure 4 uses Jinja Templating, a Python templating language embedded within the SQL code itself. This approach allows the same query to run in different databases or schemas, or even a different cluster, by updating the connection information and values specified in a couple of variables. The same code we wrote to move data from S3 to RedShift or SFTP to S3 or to publish a Tableau workbook can be used across teams, projects and environments. Jinja Templating can also be used with other structured languages or scripts, like the Tableau workbook code in figure 5.
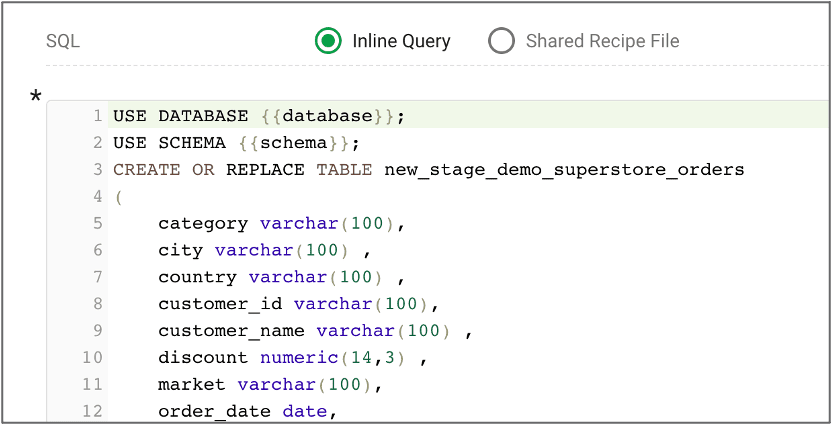
Figure 4: The database and schema are templatized using Jinja Templating to allow easy customization to different databases, schemas and clusters.
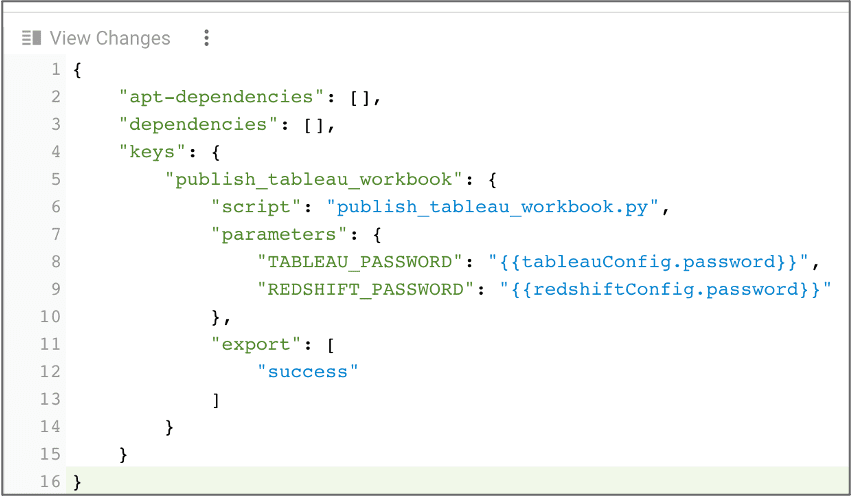
Figure 5: The Tableau and Redshift passwords are customized using Jinja Templating
Using Version Control
Adding a version control system such as GitHub enables us to manage environments, supporting faster innovation and code deployment. Suppose I want to add a new feature. In that case, I can create a feature branch and configure it to connect to an isolated environment, for example, a different S3 bucket, a separate database cluster and a dev project in the Tableau server – figure 6. I can then develop my new feature in my feature branch (sandbox environment) without breaking production. When coding is done, I test the code in the feature development environment. When it’s ready, I can merge it to higher environments and rerun the same tests. This way, automated testing is built into every stage of the release and deployment workflow, and it ensures that my pipeline is delivering high-quality analytics every time it executes.
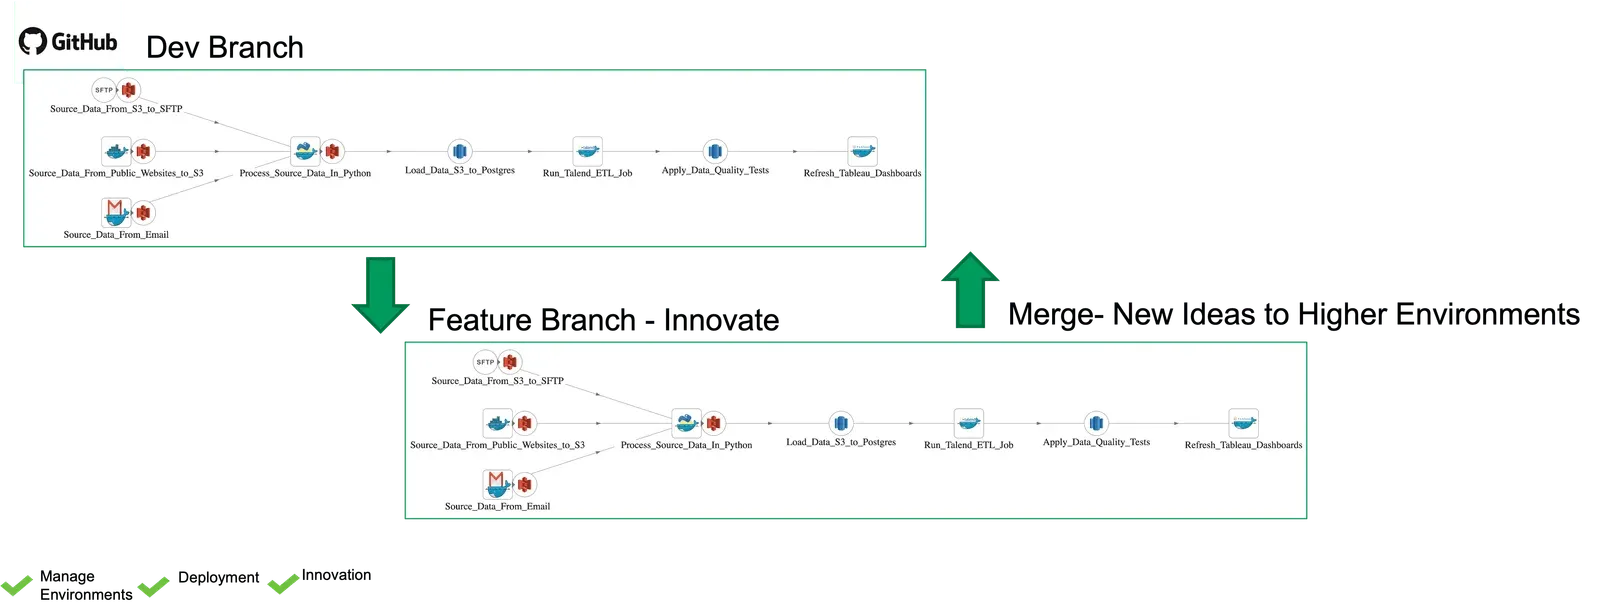
Figure 6: Isolated development environments tied to version control branch and merge operations support faster innovation.
Monitoring Job Metadata
Monitoring and tracking is an essential feature that many data teams are looking to add to their pipelines. Figure 7 shows how DataKitchen DataOps Automation helps to keep track of all the instances of a job being submitted and its metadata. The table shows the job submitted, the submitter, the start time, the duration, and the job completion status for each job.
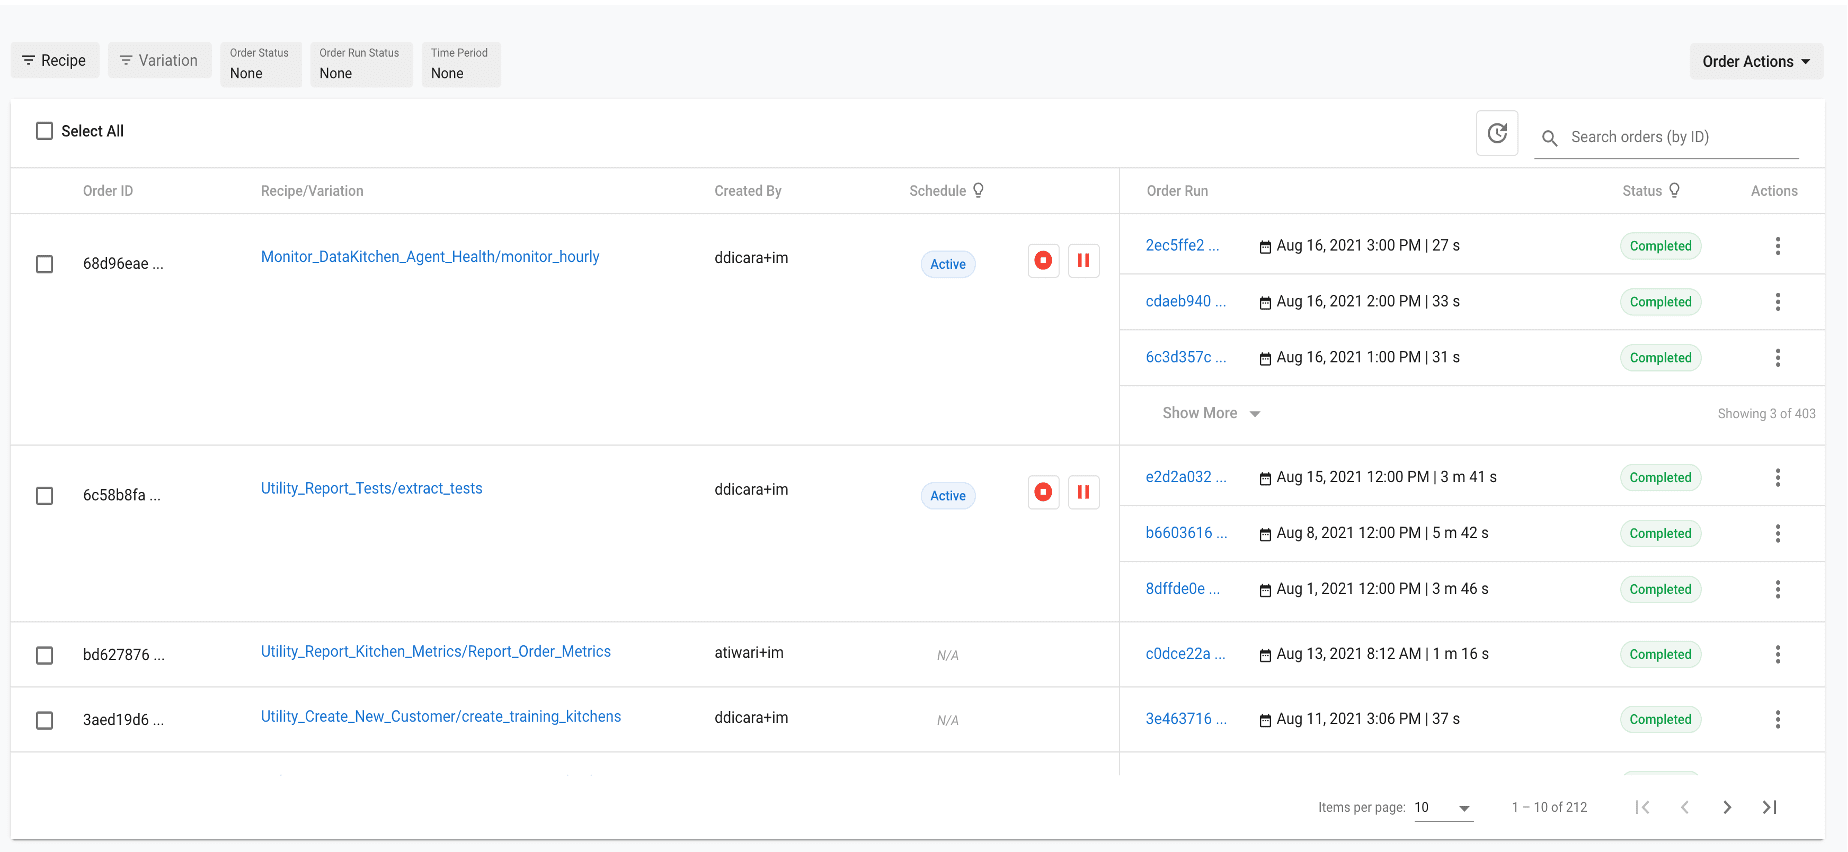
Figure 7: DataKitchen DataOps Automation keeps track of all the instances of a job being submitted and its metadata.
I also record all these metrics and analyze them to build a DataOps report to measure the progress in collaboration, keep track of production error rates, and keep track of the data error rates, test coverage and SLAs (service level agreements) – figure 8.
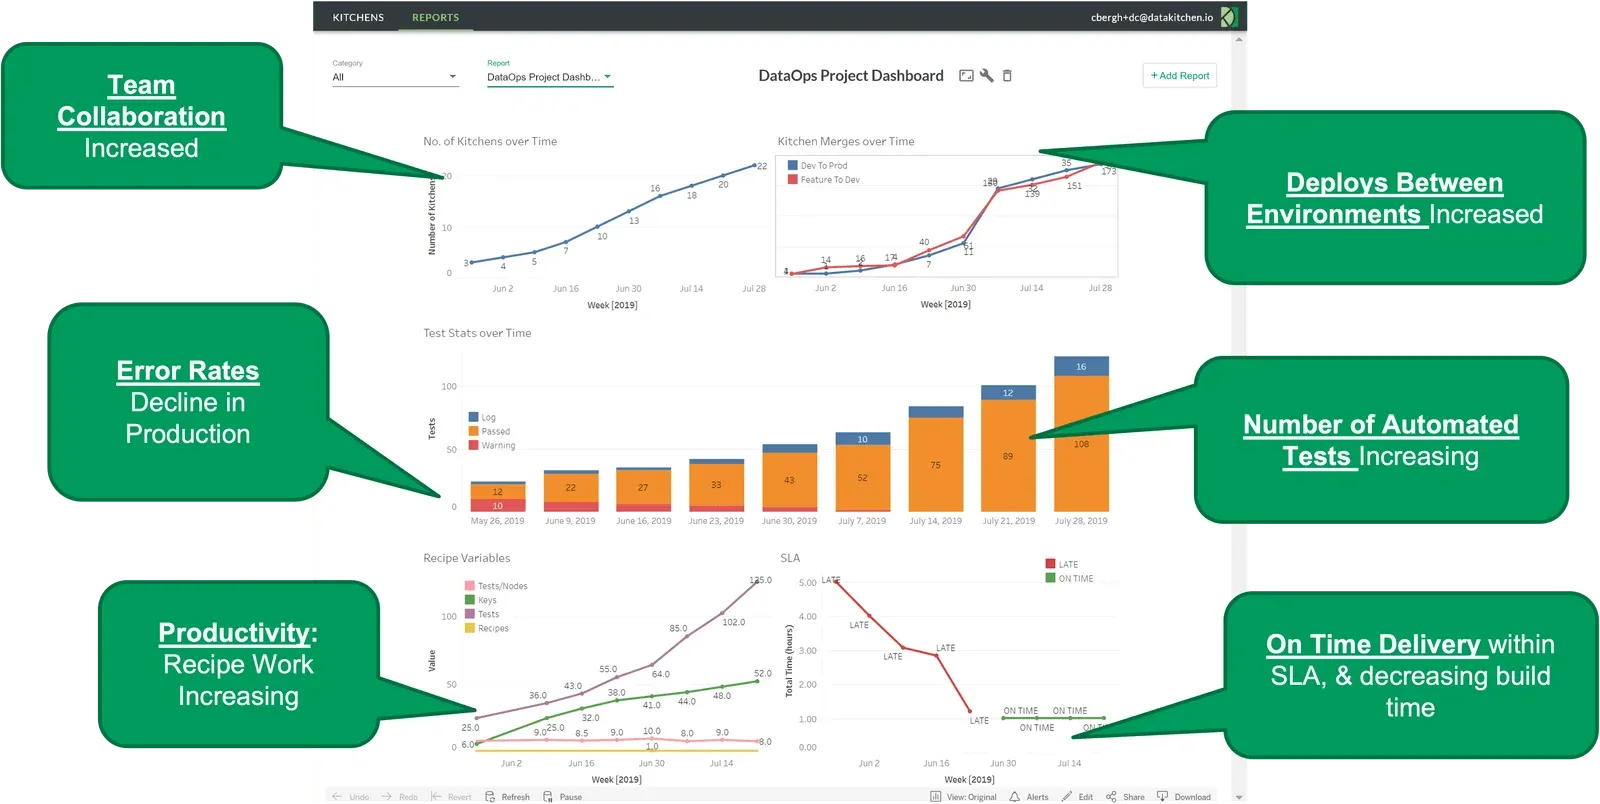
Figure 8: DataKitchen DataOps Automation tracks collaboration, productivity and quality metrics.
By introducing the change in our mindset, taking inspiration from methodologies, like Agile, DevOps and lean manufacturing, we can streamline the workflows, catch errors much earlier in the process, increase the productivity of the data teams and deliver high-quality analytics faster. In some cases, DataOps has helped us save hours, weeks and even months of work.
TIP
To learn more about DataOps Engineering, watch our webinar on this topic, A Day In the Life of A DataOps Engineer.
FAQ
What are the key points in this blog?
A DataOps implementation project runs in three steps: understand the team’s existing challenges and toolchain, agree a definition of done, then design and build. Done means deployable, monitorable, maintainable, reusable, secure and valuable to the user. In practice that means orchestrating existing tools in one pipeline, adding automated tests at every step, parameterizing code for reuse, and version controlling everything.
What does a DataOps engineer do day to day?
A DataOps engineer gathers the analytic nuggets scattered across a team — business rules from the analyst, SQL from the data engineer, an ETL job, a BI report — and orchestrates them into a single automated pipeline. The rest of the work is automation: extraction, tests at each step, alerting on failure, parameterizing code and putting everything under version control.
What are the three steps of a DataOps implementation project?
First, understand the data team’s existing challenges, including its data architecture and end-to-end toolchain. Second, establish a definition of done that covers more than working code. Third, design the data solution and implement it. The order matters: the challenges list is what tells you which parts of the pipeline to automate first.
What does done mean in a DataOps project?
A project is done when a system has been built around it: all tools, environments and processes orchestrated in one pipeline, code version controlled in something like GitHub, code parameterized for reuse across environments, enough automated tests to catch errors, error events tied to real-time alerts, a shorter cycle time for change, and process metrics you can track.
Which tests belong in a data pipeline?
Six kinds. Location balance checks that row counts match expectations at each stage. Historic balance compares current values to previous ones. Statistical process control applies statistical methods to a process. Data completeness checks for missing data, data correctness tests for incorrect data, and business rule-based tests confirm the data matches business assumptions.
Why parameterize pipeline code?
So the same code runs in every environment without edits. Jinja templating embedded in SQL lets one query run against a different database, schema or cluster by changing connection information and a couple of variables. The same approach handles Tableau workbook code, so a workbook can be published to a dev project or to production unchanged.