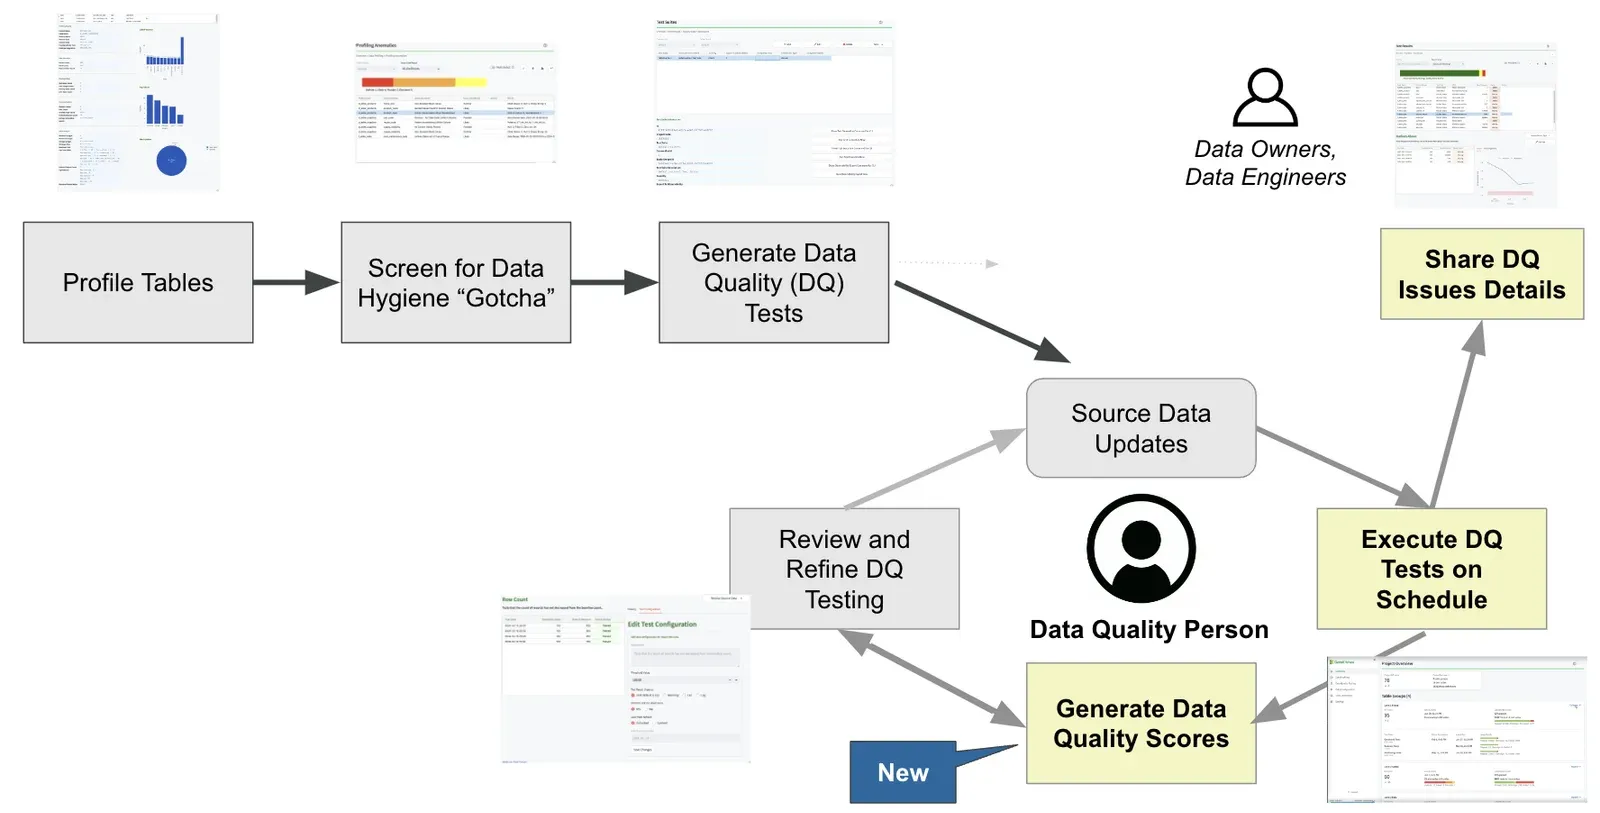
DataOps data quality is the practice of running data quality as a continuous production control rather than a project. You profile the data you already have, generate the tests from that profile instead of hand-coding them, score only the data elements the business cares about, and give the people who own the source a specific report they can act on. Then you run the whole thing again on the next tranche of data.
The definition is worth stating that way because the alternative is so common: a months-long assessment that gathers requirements, produces a document, and improves nothing. Data quality problems are not static. They arrive with every new file, schema change, and upstream release, and a one-shot project structure cannot keep up with them.
This page condenses the argument in our white paper Data Quality: The DataOps Way, which has the full version with more detail on each step.
Why do traditional data quality projects fail?
Start with how big the problem is. In dbt Labs’ 2024 State of Analytics Engineering survey, 57% of respondents put data quality among the three hardest parts of preparing data, up from 41% in 2022. IDC finds that 73% of data practitioners do not fully trust their data. Forrester puts the 2023 cost of poor data quality in the millions, and expects that number to grow as more decisions get handed to AI.
Against that, the waterfall data quality project has two structural flaws.
The first is sequencing. Requirements, analysis, documentation, and planning all happen before anything improves. Problems surface late, when they are expensive to fix, and the deliverable often no longer matches what the business needed when the project started.
The second is the assumption underneath the sequencing: that every data quality requirement can be known upfront. It cannot. You learn what your rules should be by looking at real data, and real data keeps arriving. A method that only learns at the end of a twelve-month cycle learns twelve times more slowly than one that learns every week.
Why is data quality leadership a role of influence, not control?

The person who finds a data quality problem is almost never the person who can fix it. Data quality issues cross departments, business units, and functional areas, so improvement depends on people who may see no benefit in it.
Source system owners are the clearest case. Their data is good enough for the operational job it was built to do, and by their standards nothing is broken. It only breaks when someone repurposes it for analytics. So a data quality leader identifies the problem, holds no authority over the system producing it, and has to persuade another team to prioritize a fix that helps somebody else.
That makes the hard questions social rather than technical:
- Where should the change be made?
- Who is responsible for making it?
- Why should the rest of the organization care?
- What information justifies and guides the change?
- How do you motivate the person who has to do the work?
DataOps data quality is built around those questions. It assumes you have influence and no control, so everything it produces is evidence you can hand to someone else.
What does DataOps change about data quality?
DataOps applies Agile, Lean, and DevOps thinking to data and analytics. Applied to quality, six ideas do most of the work.
One motivated individual
The people closest to the data are usually the ones who can see what is wrong with it. Give one of them a tool and the autonomy to use it. Don’t wait for a mandate from the top. One motivated person with profiling results beats a steering committee with a charter.
Experimentation and iteration
You do not need a perfect score or a perfect test before you act. Start small, measure, ship something that works, and refine it with what you learn. Getting something 70% right today beats a perfect solution later, because the 70% version is already telling you where the problems are.
Leverage

Progress rarely comes from more headcount. It comes from finding the point where a small push moves something large: automating the tests nobody has time to write, or pulling in a domain expert for the twenty minutes when their knowledge is worth the most.
Measure before you set standards
Measure first, then write the standards. Early measurements create the baseline that every later claim of improvement is judged against, and they tell you what the standards should say. Waiting for a formal standard before measuring anything delays every decision that follows it.
[G]ood quality and the proper uniformity have no meaning except with reference to the consumer’s demands.
Deming, W. Edwards. (1953). Statistical Techniques and International Trade, Journal of Marketing, 17(4), page 428
Continuous learning
Every cycle teaches the team something about its own data. Fast cycles mean more lessons, which is why the standards produced this way end up better than the ones written in advance by committee.
Automate every check
Hope is not a test, and neither is a business review or a green pipeline run. If no test checked it, you don’t know it’s right. Manual checks run when someone remembers, and nobody remembers at 2 am. Data arrives every day, so every test runs automatically, on every load.
Where do you start with DataOps data quality?
Not with an organization-wide program. Start with one person who wants the data to be better and has influence with the teams that own it, and give them a tool that installs in hours and costs nothing to try. That combination is deliberately small: it removes the two things that usually stall a data quality effort, which are budget approval and IT scheduling.
The same logic applies if you are adopting DataOps itself. Nobody adopts all of the DataOps Manifesto’s principles on Monday, so start with automated data tests. They are the cheapest step, your customer feels them first, and orchestration, CI/CD, and observability all depend on knowing whether the data is right.
What are the seven steps to do data quality the DataOps way?
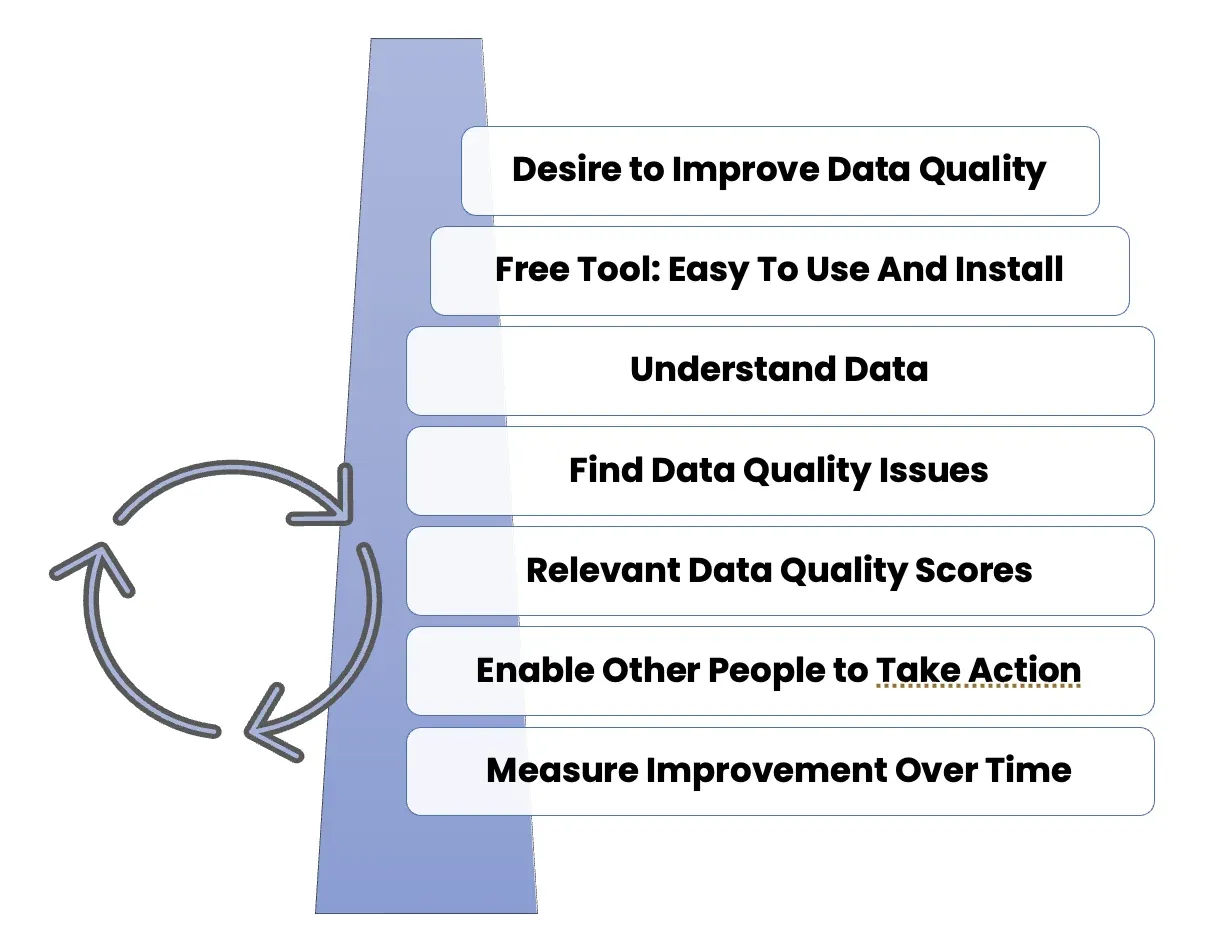
The sequence starts with a person, not a framework. The circular arrow is the point: this is a cycle you re-enter, not a project you finish.
| Step | What you do | What you get |
|---|---|---|
| 1 | Find someone who already wants the data to be better | A motivated owner, not a mandate |
| 2 | Give them a free tool that installs in hours | No budget cycle, no IT queue |
| 3 | Profile the data | Evidence instead of opinion |
| 4 | Generate the tests | Coverage that doesn’t depend on hand-coding |
| 5 | Score what the business cares about | A number a stakeholder will act on |
| 6 | Share an actionable issue report | The fix lands with the person who owns the source |
| 7 | Track the score over time | Proof the practice is working |
Step 1: Start with a desire to improve data quality
Find the person who is already tired of being the data quality nag. They know which tables lie and which reports get quietly corrected by hand. What they lack is evidence and leverage, not motivation.
Step 2: Give that person a free tool
The tool has to install without IT support or new infrastructure, so they can profile their first table the same afternoon. Every additional prerequisite is another week of waiting, and waiting is what kills these efforts.
Step 3: Help them understand their data through profiling
Data profiling shows what is actually in the data: missing values, mixed types, unexpected patterns, values nobody knew were still in use. It is the best opening move for a data quality workshop because it replaces opinion with evidence. As Deming put it, without data you’re just another person with an opinion.
Step 4: Identify data quality issues
Coding hundreds of tests by hand for every table is work that never gets finished, so the tests have to be generated for you. Four categories cover most of what you need:
- Hygiene screening: the mechanical problems that quietly break downstream numbers. Numbers stored in text columns, dates stored as strings, several different representations of blank, inconsistent string patterns.
- Generated tests from the profile: the profile becomes the baseline, and the baseline becomes parameterized tests. Freshness, volume, schema change, data drift, required values, missing-value percentages, uniqueness, list of values, truncation, record counts inside a time window, minimum and maximum against baseline, distribution shift.
- Configurable business rules: the tests that need domain knowledge rather than history. Every SKU exists in the distributor list, delivery status only ever holds one of five values, referential integrity across two tables. A data steward can set the threshold themselves instead of filing a ticket, and the rule doubles as documentation.
- Custom tests: the industry-specific cases that need SQL, such as a rule that the number of medical practices cannot exceed the number of doctors. Reserve your programming expertise for these and let generation handle the rest.
Step 5: Create relevant data quality scores
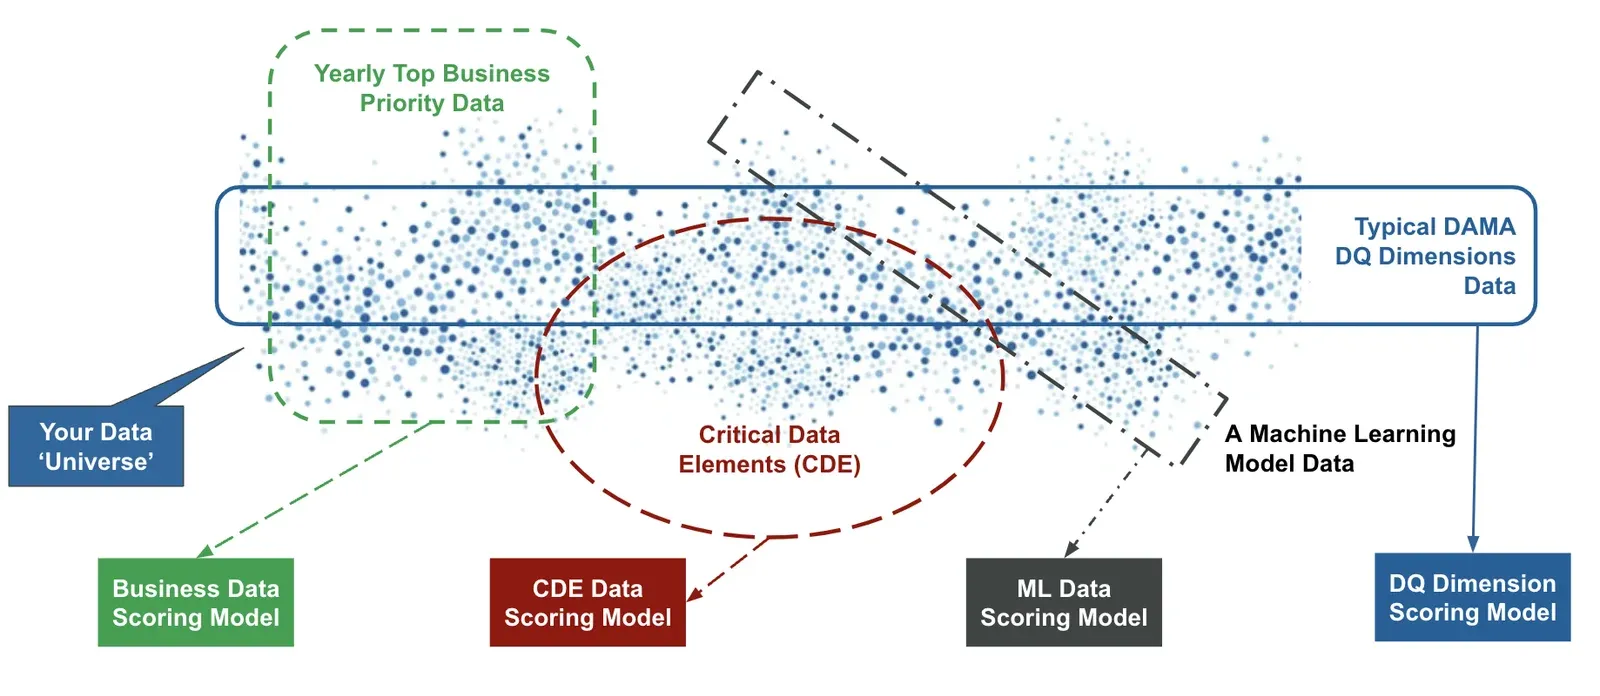
A score is how you communicate the state of the data to someone who will never open the tool. Two rules keep scores useful. Score only the elements the business cares about: nobody changes their behavior over the completeness of a fax number field. And build several models for several audiences rather than one universal number, whether that is critical data elements, DAMA quality dimensions, or the feature set behind one machine learning model. Start with a few metrics one customer actually cares about, then expand as they start trusting the number.
NOTE
On choosing what a score should actually measure, see The Six Types of Data Quality Dashboards and Why Your Data Quality Dashboard Isn’t Working.
Step 6: Make it easy for other people to act
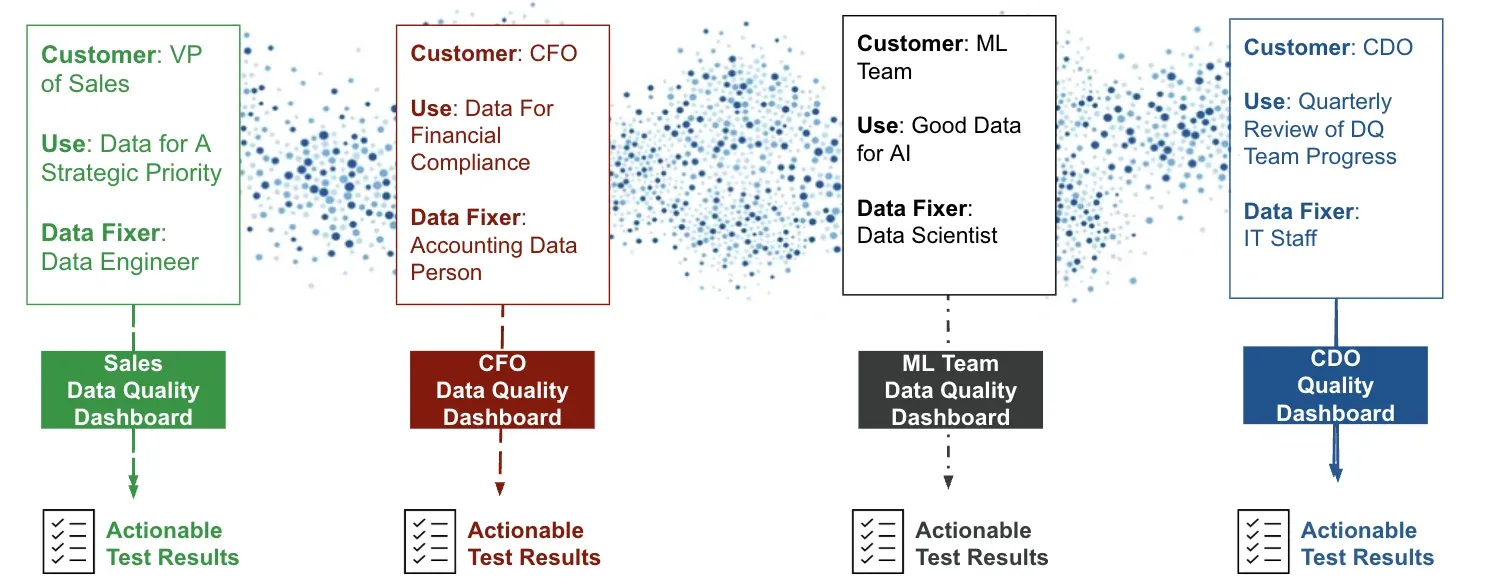
Every dashboard should have one named customer and one named person who can fix the data. That pairing is what turns a score into a change. What you hand over is a shareable package: what the problem is, what it affects, how to reproduce it, and what to change. Route it through the workflow tools the organization already uses so the fix gets tracked and assigned like any other work.
Step 7: Measure improvement over time
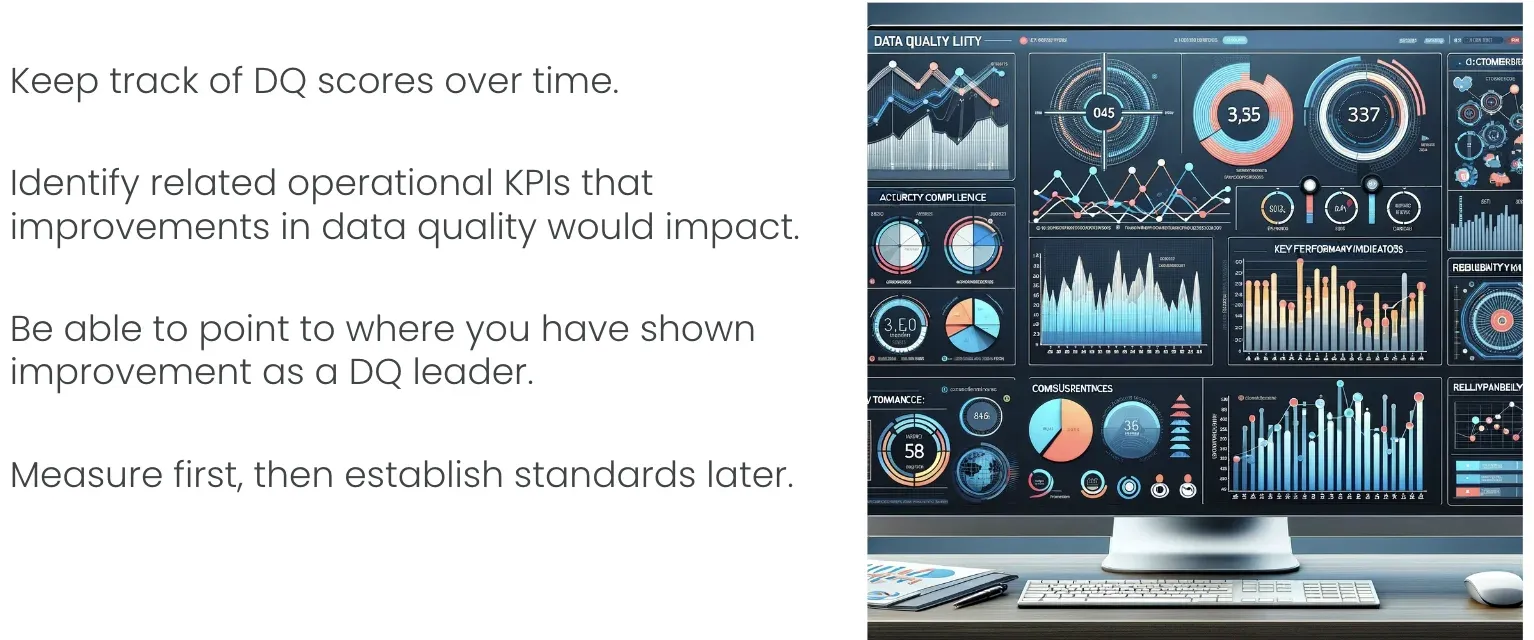
Keep the scores over time, and tie them to operational KPIs someone above you already watches. One score is an opinion; six months of scores tied to a KPI your boss already watches is a budget. If you don’t know where to begin, start with two numbers: errors in production and time to ship a change. The trend line is the evidence a data quality leader points at when asking for more room to work. Expect the tests behind the scores to need refinement as new data arrives: fewer false positives each round is itself a sign the practice is maturing.
What does the data quality influence and action cycle look like?
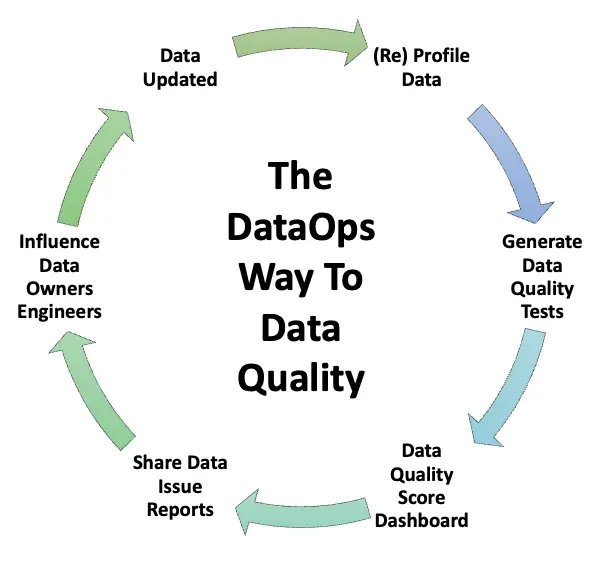
Steps 3 through 7 are not a straight line. Once they are running, they form a loop with no phase gates and no sign-off:
- New or updated data arrives.
- Re-profile it. The baseline moves, so measure the current state again.
- Generate the tests. Catch the new problems before anything downstream does.
- Publish the score. Quantify the health of the elements that matter.
- Share the issue report. Specific, actionable changes for the people who can make them.
- Influence the data owners and engineers. The only step that is not technical, and the one the other five exist to support.
Then it runs again. Compare that with the waterfall version, where the equivalent of step 6 arrives once, twelve months in, as a document.
| Waterfall data quality project | DataOps data quality cycle | |
|---|---|---|
| Unit of work | One project with phase gates | One tranche of data, repeated |
| Requirements | Gathered upfront, assumed complete | Discovered by profiling real data |
| First measurement | After analysis and design | Day one, before standards exist |
| Feedback | Once, at the end | Every iteration |
| What ships | A document | A score, an issue report, a fix |
| When problems surface | Late, when they are expensive | On the next run |
Where should data quality tests run?
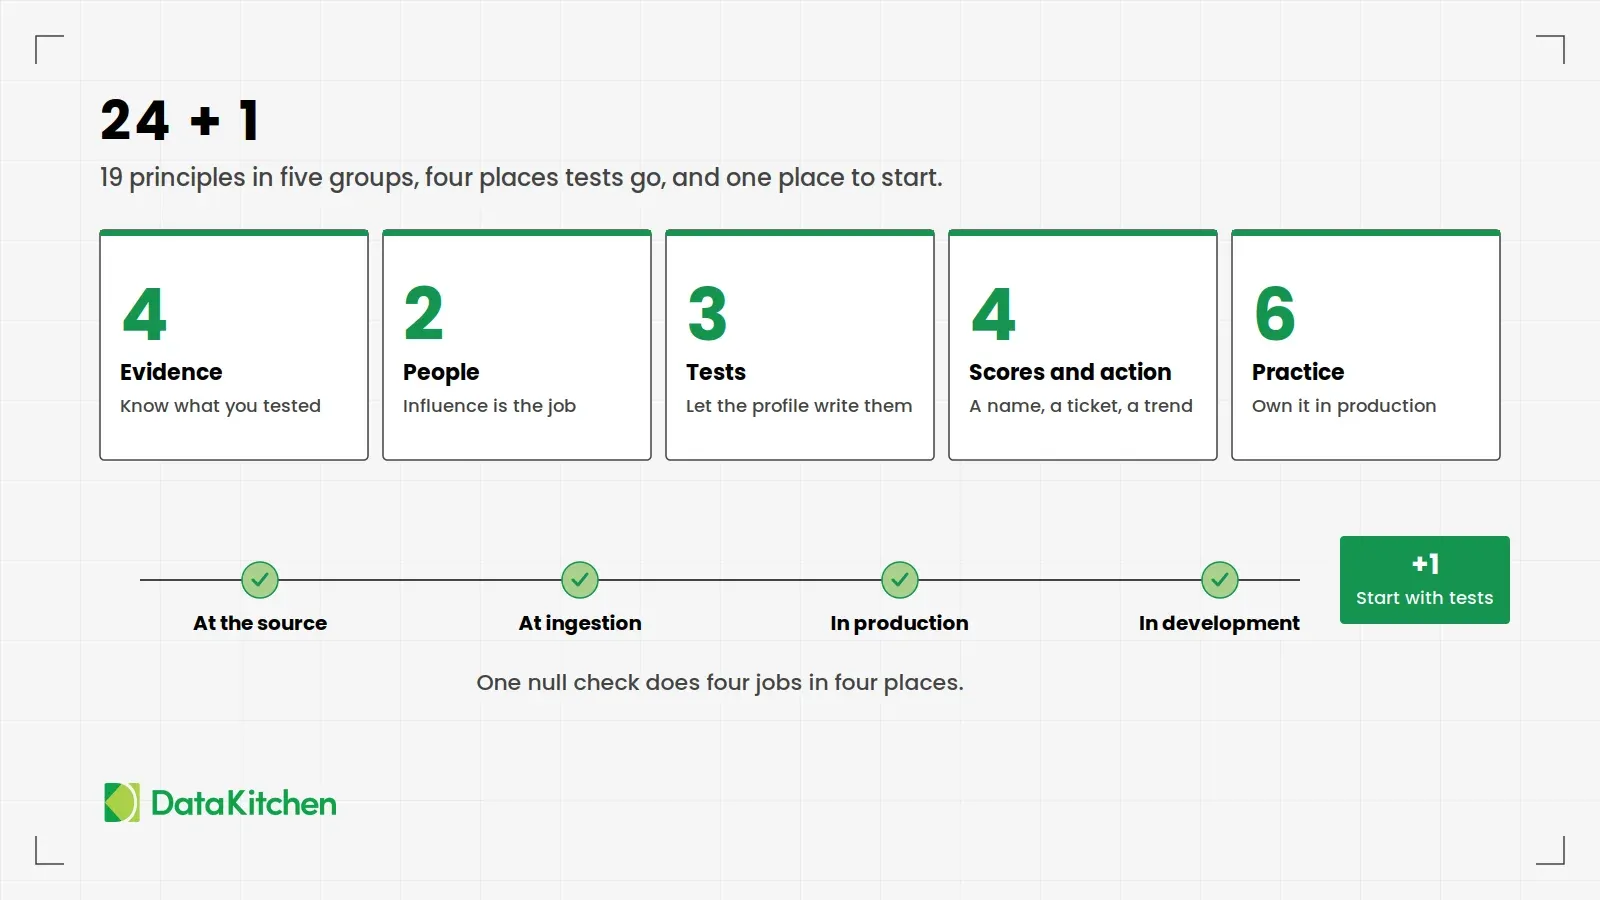
At four points, not one. A factory puts quality stations along the line instead of inspecting the product at the end, and data works the same way. The same null check does a different job in each place, and skipping any one of them leaves a failure you hear about from someone else, usually the customer. Teams building a medallion architecture often test only the layer they own, which is exactly the gap this closes.
- At the source: prove the source is fit for purpose, one table and one column at a time. You don’t own it, so your evidence has to persuade the person who does.
- At ingestion: watch every table for freshness, volume, schema changes, and drift. Nobody can watch 6,000 tables by hand; anomaly detection can.
- In production: put a tripwire between every layer and stop the line on a defect. Not every failure earns a stop, so decide in advance which ones halt and which ones warn. Production stays on the last known good data while someone looks.
- In development: run today’s code against a clone or slice of yesterday’s production data before you deploy. Rename a column, and a red light should tell you which downstream report you broke. A bug caught here costs a fraction of what it costs once your customer finds it.
Cover every table, every column, every tool, and every number your customer reads, and run all of it automatically.
What practices keep DataOps data quality working?
The seven steps get a practice started. These habits keep it from decaying back into a project:
- Treat tests as a shared resource: the analyst, the steward, the engineer, and increasingly an AI model all touch the same rule, and only one of them has a Git account. Keep every test and every result in one database of record, reachable by a person through a UI, by code through an API, and by a model through MCP. One copy is authoritative, and every change goes to Git for diff, review, and rollback. More in Data Quality Testing: A Shared Resource for Modern Data Teams.
- Love your errors: each defect teaches you something about your data or your process. Review them together in a quality circle and fix the step that produced them. Blame the step, not the person.
- Cut the noise: an alert nobody trusts is worse than no alert. Tune every test until a failure means something, and send it to the person who can act on it. Demote the tests that fire every night; never mute them.
- Put delivery terms in tests: a data contract is a set of tests both sides agree to. Terms you can run beat promises you can’t.
- Prove the migration: a migration promises that the new system holds the same truth as the old one. Test both sides and prove it, from row counts to column values.
- Own it in production: deploying is the middle of the job, not the end. Somebody watches the line, and that somebody is the data team.
- Test what the agent wrote: an AI agent ships a transformation in seconds and keeps none of the pipeline in its head. Let it draft the fix ticket and the custom SQL, and treat everything else it touches as untested until a test says otherwise. See The Seven Deadly Sins of AI-Generated Data Pipelines.
What are the advantages of DataOps data quality?
Five things follow from running quality this way. Coverage keeps up with the estate, because consistency, accuracy, and completeness checks get applied across thousands of columns automatically instead of one table at a time. Trade-offs get made on evidence, so decisions about speed, cost, and quality come from what the data says and not from somebody’s sense of what is probably fine. Expert time goes where it counts, because generation handles the routine checks and leaves your engineers and domain experts the hard, specific cases. Improvement starts in week one instead of quarter three. And the standards themselves get better: more iterations mean more learning about your own data, and standards written from that learning beat standards written in advance.
How is DataOps data quality different from DataOps process observability?
They cover different halves of the same problem, and you want both.
Data quality tests the data: is this column complete, is this value in range, did the schema change. DataOps Observability watches the process that produces the data: did every step run, in the right order, on time, with the tests passing at each stage, across every tool in the estate.
Testing source data alone does not catch a job that silently half-finished, and a green pipeline says nothing about whether the numbers in it are right. The quality worth testing is the whole delivery: perfect data run through the wrong code, report, or model is still an error, and your customer can’t tell the difference. Both together are what the paper means by:
Quality = Data Quality + Process Quality
Where does DataOps TestGen fit into data quality?
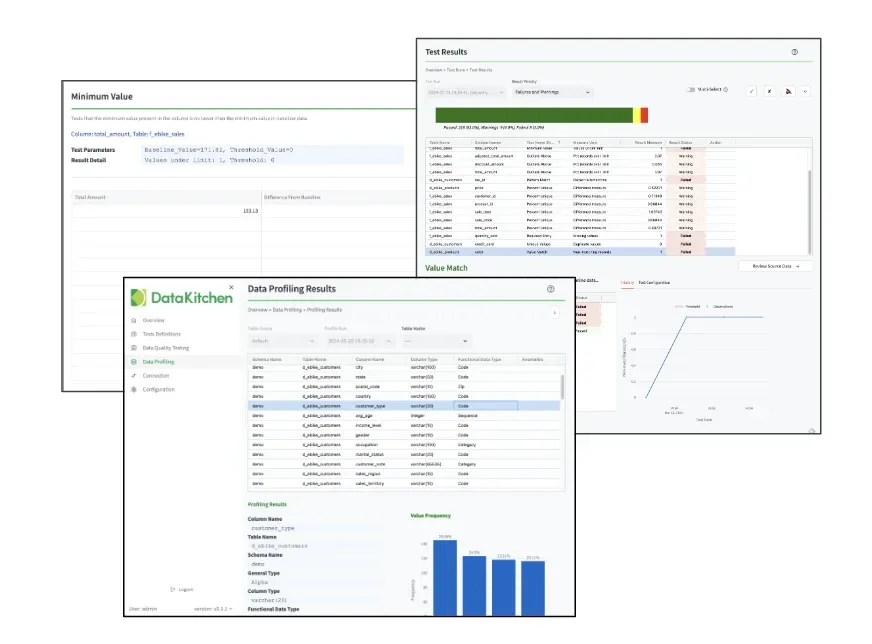
Steps 2 through 7 describe a tool, and DataOps Data Quality TestGen is the one we built to be it. It is open source, it installs on a laptop, and it is the free tool step 2 refers to.
What it does maps onto the steps directly:
- Profiling (step 3): 55 baseline characteristics per column, so the first look at a table is a page of facts rather than a query someone has to write.
- Hygiene screening (step 4): 32 detectors for the mechanical problems: type mismatches, hidden blanks, string pattern inconsistencies, truncation.
- Generated tests (step 4): 34 test types derived from the profile, with no Python, no SQL templates, and no YAML to maintain.
- Configurable business rules (step 4): 19 test types a data steward can set up and re-parameterize without an engineering ticket.
- Scores and dashboards (steps 5 and 6): configurable scorecards over the data elements you choose, plus exportable issue reports to hand to the person who owns the source.
- Trend over time (step 7): score history, so improvement is a chart rather than an assertion.
It connects to Snowflake, Databricks, Azure Synapse, SQL Server, PostgreSQL, and others, and it runs where your data already lives. No data leaves your environment.
TIP
Install open source DataOps TestGen: free, runs on a laptop, and profiles your first table in under an hour. That is step 2 of the seven, done this afternoon.
In short
DataOps data quality is data quality run as a continuous production control: one motivated person, a free tool that installs in hours, profiling that produces evidence, tests generated rather than hand-written, scores aimed at the data the business actually cares about, and an issue report that lands with the person who can fix it. Measure before you set standards, expect the first version to be 70% right, and run the cycle again on the next tranche of data. That is the whole method, and it is the opposite of a twelve-month assessment that ends in a document.
Where can I learn more?
A great place to start is The DataOps Way to Data Quality, our free book on data quality and data observability. Other useful resources include:
- The DataOps Quality Manifesto — 24 principles and a plus one, on one page
- Data Quality: The DataOps Way — the full white paper this page condenses
- What Is DataOps? — the discipline this applies to data quality
- What Is DataOps Process Observability? — the process-quality half of the picture
- How Data Quality Leaders Can Gain Influence and Avoid the Tragedy of the Commons — why shared data degrades when nobody owns the repair
- The Six Types of Data Quality Dashboards — picking the scoring model that fits the audience
- The Seven Deadly Sins of Data Quality — the habits this approach is meant to break
- A Guide to DataOps Tests — what to test, and where in the flow to put each test
- DataOps Data Quality TestGen