Introduction
NOTE
This paper was updated in August 2026. It was first published in June 2023. The counts, test names, architecture, deployment model and security detail are current as of this update, and it now covers capabilities that did not exist at first publication: table monitors, quality scores, the Data Catalog with PII and Critical Data Element flags, the REST API, the MCP server, roles and single sign-on, and the edition split. A section on what TestGen deliberately does not do has been added.
The mechanism the paper describes — profile a column, derive tests from the profile, run them inside your own database — has not changed. For figures that move between releases, the TestGen documentation is authoritative.
Does this sound like your team? Are you a member of a stressed-out, overworked data team that directly provides insight to customers by both building and running complex data journeys? Do your data journeys produce embarrassing data errors regularly? Are you aware that only 22% of data engineers’ time is spent on innovation, but 78% on errors and manual execution (Gartner 2022)? Are you aware that a 2021 survey of 600 data engineers by DataKitchen and data.world found that 50% of data engineers named too much time finding and fixing errors as a source of burnout?
Imagine having a simple and fast way to generate and execute data quality tests in your data journeys without hassle. With DataKitchen DataOps TestGen, you can avoid tedious and time-consuming manual test development processes. Our software is designed to be simple, fast, and highly efficient and deliver many valuable data quality validation tests in minutes. It automates the entire data profiling, test generation, and execution process, saving you valuable time and resources. With DataOps TestGen, you can focus on what matters most — delivering trusted insight to your customers — while TestGen ensures data accuracy and quality. Say goodbye to the complexity of writing data tests yourself. DataOps TestGen takes care of that for you, automating the terms and conditions of your data contract through simple, automatically generated data test creation and execution.
DataOps TestGen is the “Easy Button” for data quality monitoring and anomaly detection. Our robust software streamlines the entire testing process, making it a breeze to identify and rectify any data errors or anomalies.
The Problem DataOps TestGen Solves
Make embarrassing and costly data errors a thing of the past. Most data engineers are so busy that they don’t have time to write data quality validation tests or the business domain expertise needed. As a result, tests go unwritten, and production systems have problems, reducing end-user trust. Their lack of time and understanding means they need a standard set of data tests created automatically and a process to tweak existing production tests when new data comes in. For more advanced business-specific testing, they need a set of tests configured easily in concert with data stewards. Together, those two kinds of test let data teams detect problematic data records efficiently.
Problem #1: Costly production data errors are found by customers — or not at all. Data errors cause your customers to mistrust the data, are hard to find, take time to investigate, and waste your time on re-work. Data errors can cause compliance risk and have an opportunity cost for the business because of downtime during errors. And incorrect data or wrong reports and models can cause costly business mistakes.
Problem #2: Data teams don’t have the time or business understanding to create data quality validation tests. Data engineers deal with hundreds of data journeys, diverse data sets, tools, and diverse customer needs. They have backlogs on their daily task lists. So they don’t have time or energy to learn about each data set or customer to create robust production data tests. They need help creating tests that fit their data and customers’ needs without taking significant time to set up or babysit once they go live. They also need help adding new types of tests for the business and adjusting tests when new data arrives.
Essential Product Features
One of the banes of the data team is manual data testing. Manual testing takes time and effort and is error-prone. Always test your data automatically, not manually. Execute automatic data validation tests with parameters that can be changed based on inputs and business conditions — saving re-work and duplication. DataOps TestGen creates and executes data tests automatically.
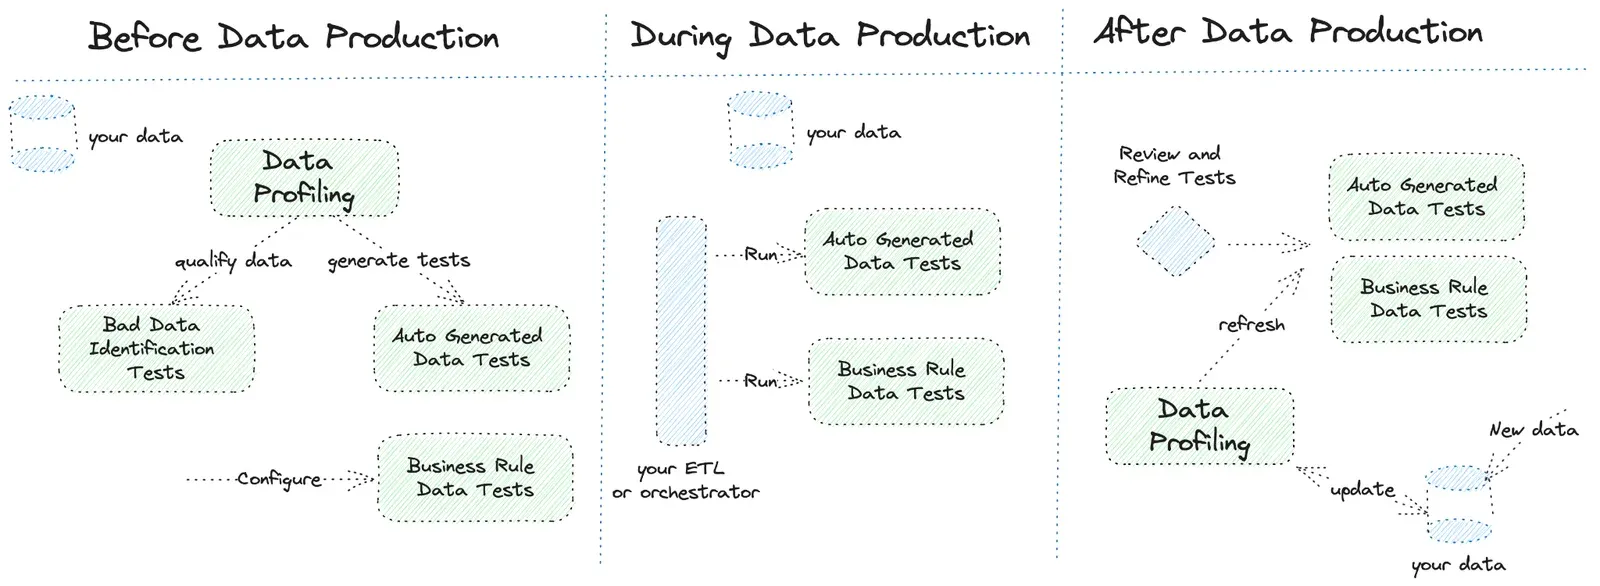
DataOps TestGen automatically tests data before, during, and after data production. Within minutes of installation, its components cover all three phases:
| Before production begins | During production, TestGen executes | After production ends, TestGen lets users |
|---|---|---|
| Creates data profile — identifies 55 baseline characteristics per column | Auto-generated data tests | Evaluate test results |
| Bad data detection tests find data problems | Custom business rule data tests | Review and refine test parameters |
| Creates auto-generated tests from data profile characteristics | Any existing data tests already in use, even those generated outside of TestGen | When new data arrives, refresh the data profile and the auto-generated thresholds |
| Optionally configure custom business rule tests |
Data Profiling
Data profiling is the periodic x-ray of tables in a schema to gather extensive information about the contents of each column. Results are stored in a standard table in DataOps TestGen. This table is available for direct review and is used for rules derivation downstream. As more versions of a dataset are profiled, the derived testing gets better.
Because profiling conducts a separate query on each column of every table analyzed, profiling is not meant to be part of the production data validation testing process. Typically, you might profile data on a weekly or monthly basis. The profiling step allows you to perform profiling on a random percentage of records within a table. But we recommend analyzing the entire table where possible, even if the process takes some time, to capture the fullest picture of the data.
The 55 baseline characteristics gathered per column are grouped as follows:
| Type | Data profiling characteristic name(s) |
|---|---|
| Averages | Average Embedded Spaces, Average Length, Average Value |
| Column & table types & names | Column Name, Column Type, Functional Data Type, Functional Table Type, General Type, Table Name |
| Date characteristics | Before 1yr Date Count, Before 5yr Date Count, Data Type Suggestion, Date Count, Date Days Present, Date Months Present, Date Weeks Present, Future Date Count, Within 1mo Date Count, Within 1yr Date Count |
| Minimum/maximum value | Maximum Date, Maximum Length, Maximum Text, Maximum Value, Minimum Date, Minimum Length, Minimum Text, Minimum Value, Minimum Value Gr0 |
| Numeric counts | Boolean True Count, Embedded Space Count, Filled Value Count, Fractional Sum, Lead Space Count, Numeric Count, Record Count, Value Count |
| Percentiles | Percentile 25, Percentile 50, Percentile 75 |
| Position | Position |
| Top N | Top Frequent Values, Top Patterns |
| Unique values | Distinct Pattern Count, Distinct Standard Value Count, Distinct Value Count, Distinct Value Hash |
| Zero length or nulls | Null Value Count, Zero Length Count, Zero Value Count |
Data Hygiene Detectors
Once data profiling is complete, the data hygiene detectors report against those results. They automatically confirm how closely data structures and assumptions match the actual contents of each column. Results can be used to assist the Data Engineer in refining data structure definitions and target the addition of data ‘patching’ steps which help to generate a more usable, analyzable dataset.
A reasonable approach would be to review the hygiene findings to start and make any changes that may be required to address issues raised. Then, when you have a reliable dataset, you can rerun profiling and the hygiene detectors repeatedly.
Below are the 32 data hygiene detectors, grouped as the documentation groups them. Each is reported with a likelihood — Definite, Likely or Possible — so a reviewer can triage rather than treat every finding as an error.
Data type and format (14). Suggested data type · Character column with mostly numeric values · Character column with mostly date values · Character column with numbers and units · Delimited data embedded in column · Leading spaces · Quoted values · Non-printing characters · Non-alpha name or address · Non-alpha prefixed name · Inconsistent casing · Invalid USA zip code format · Invalid USA ZIP-3 format · Personally identifiable information
Missing and incomplete data (5). No column values present · Non-standard blank values · Small percentage of missing values found · Potential duplicate values · Similar values match when standardized
Value and pattern consistency (8). Pattern inconsistency within column · Pattern inconsistency across tables · Multiple data types per column name (major) · Multiple data types per column name (minor) · Unexpected boolean values · Variant codings for same values · Small percentage of divergent values · Unexpected numeric values
Unexpected content and dates (5). Unexpected column contains emails · Unexpected column contains US states · Unlikely dates out of typical range · No table dates within one year · No table dates within six months
Automatically Generated Data Tests
Once profiling is complete, optionally, TestGen can automatically derive a set of data quality validation test rules on all columns profiled. Typically between two and nine tests are generated per column. The total tests generated can be in the thousands for a full schema. Although profiling itself can take some time, test generation is high-speed.
The goal of Automatically Generated Data Tests is to cast a wide net for data problems that can’t be predicted by targeted testing devised in advance. It’s the same way you might set up a burglar alarm in your home by deploying sensors at all possible entrances to catch a burglar who would only try one window. Your goal in refining these tests is to maintain maximum sensitivity to real problems while minimizing false positives that are not worth the follow-up.
Does this take some effort? Of course! The benefit is that it’s much less work to refine a small number of tests that miss the target. It’s much more work — if not impossible in the real world — to manually create a blanket of relevant tests that can alert you when anything goes wrong. And when you are refining tests, you have direct access to the result history for that test and profiling data for that column, which makes it even easier.
Initially, the value of the tests is only as good as the quality of the baseline dataset. By definition, subsequent tests conducted on the same baseline data should all pass. Accordingly, TestGen’s test generation process allows you to base your tests on a prior version of profiling results — based on an older version of data — so you can immediately evaluate and refine your tests on the current version of your dataset. Or you can use the current data as your baseline and initiate testing against subsequent versions of data.
You can regenerate your tests as often as you like. You may choose to do this periodically. But the point is not to keep regenerating tests that change. It’s to build a consistent set of rules that can be applied to new data.
The tables in this section and the next list the test types under the names they
carried at first publication. Many have since been renamed in the product —
Missing Percentage is now Percent Missing, Unique Percentage is now
Percent Unique, Outlier Percentage Above is now Outliers Above, and so on —
and the current library is 49 test types: 33 generated from the profile, 14
configured by hand, and the Freshness and Schema table monitors. Use
the test-type reference
for the names as they appear in the UI today. The mechanics below are unchanged.
The 33 test types below are generated automatically from the profile. Names and groupings follow the test-type reference.
Accuracy (5). New Shift — a statistically significant shift in the mean of
new values against the baseline average. Outliers Above and Outliers Below —
the share of values more than two standard deviations from the baseline mean
exceeds a threshold. Variability Increase and Variability Decrease — the
standard deviation has moved significantly against baseline.
Completeness (6). Required Entry — generated where profiling found every
value populated, on tables of ten rows or more. Percent Missing — generated where
some values are missing. Daily Records, Weekly Records and Monthly Records —
generated for date columns spanning enough history without gaps. Volume — row
count movement, generated by the monitoring system.
Consistency (4). Average Shift — for numeric columns with ten or more
distinct values. Constant Match — where a column holds a single distinct value.
Value Match — for boolean, code or category columns with two to ten distinct
values. Decimal Truncation — for numeric columns with fractional values in
cumulative tables.
Timeliness (5). Recency — the latest date is within a set number of days of
the test date. Date Count — the count of distinct dates has not dropped against
baseline. Past Dates and Future Year — the maximum date is not beyond the test
date, or beyond one year past it. Table Freshness — whether the table changed,
by comparing data fingerprints across runs.
Uniqueness (3). Unique Values — generated where every value is distinct, on
tables over 500 rows. Percent Unique — where more than ten distinct values exist
in a non-measurement column. Duplicate Rows — the system picks the columns that
should together form a unique key.
Validity (10). Alpha Truncation — maximum character count has not dropped
against baseline. Email Format, Street Address, US State, Valid US Zip and
Valid US Zip-3 — format and domain checks generated when profiling recognises the
content. Minimum Date and Minimum Value — earliest date or lowest number does
not fall below baseline. Value Count — distinct value count has not dropped.
Pattern Match — values still match the alphanumeric patterns seen at baseline.
Business Rule Configurable Data Tests
Fourteen test types are configured rather than generated, because a profile cannot infer intent. You supply the threshold, the reference, or the condition.
Reconciliation and totals (6). Reference Match compares a column or key set
against a reference table. Aggregate Balance, Aggregate Balance Percent and
Aggregate Balance Range confirm sums and totals tie out, exactly or within a
tolerance. Aggregate Minimum guards a floor value. Value Match All requires
every value from a list to be present.
Timeframes (2). Timeframe Match and Timeframe No Drops compare a window of
recent data against the equivalent earlier window.
Row counts (2). Row Count asserts an absolute count. Row Range asserts a
band.
Custom logic (2). Custom Condition expresses a row-level rule. Custom Test
covers any error condition you can write as a SQL query across one or more tables.
Distribution and trend (2). Distribution Shift compares probability
distributions using Jensen-Shannon divergence. Metric Trend watches a derived
number over time.
NOTE
A single test runs inside one connection, so it cannot join a source in one database to a target in another. For a migration reconciliation across two platforms, the working pattern today is to copy a test suite between connections through the REST API or the MCP server so the same checks run on both sides and the results reconcile. Native cross-database reconciliation is on the roadmap, not shipped.
Summary of DataOps TestGen Profiling, Bad Data Detectors, and Data Quality Validation Testing
| Capability | Count |
|---|---|
| Data profiling characteristics per column | 55 |
| Data hygiene detectors | 32 |
| Automatically generated data test types | 33 |
| Business rule (configurable) data test types | 14 |
| Total test types | 49 |
| Table monitor types (freshness, volume, schema, metric) | 4 |
| Tests typically generated per profiled column | 2–9 |
DataOps TestGen Profiling and Data Quality Validation Tests Organized by Data Quality Dimension
How can you assess your data quality? Data quality meets six dimensions: accuracy, completeness, consistency, timeliness, validity, and uniqueness. DataOps TestGen profiling and test results can help compare your data against these definitions of the data quality dimensions:
- Accuracy — how well does a piece of information reflect reality?
- Completeness — does it fulfill your expectations of what’s comprehensive?
- Consistency — does information stored in one place match relevant data stored elsewhere?
- Timeliness — is your information available when you need it?
- Validity — is data in a specific format; does it follow business rules, or is it unusable?
- Uniqueness — is this the only instance in which this information appears in the database?
| Data quality dimension | Data quality validation tests | Data profiling characteristics |
|---|---|---|
| Accuracy | Aggregate Match No Drops, Custom Query, Incremental Average Shift, Outlier Percentage Above, Outlier Percentage Below | Average Value, Maximum Value, Minimum Value, Minimum Value Gr0, Boolean True Count, Numeric Count, Fractional Sum, Percentile 25/50/75, Standard Deviation Value |
| Completeness | Daily Record Count, Missing Percentage, Monthly Record Count, No Column Values Present, Potential Duplicates, Required, Row Count, Row Count Percentage, Weekly Rec Count | Filled Value Count, Null Value Count, Record Count, Value Count, Zero Value Count |
| Consistency | Aggregate Match Same, Average Shift, Distinct Value Change, Leading Spaces, Multiple Data Types Per Column Name, Non-standard Blank Values, Pattern Inconsistency, Prior Match, Relative Entropy, Time Window Match No Drops, Time Window Match Same | Filled Value Count, Null Value Count, Record Count, Date Count, Value Count |
| Timeliness | Distinct Date Count Change, Future Date, Future Date One Year, Recency | Before 1yr Date Count, Before 5yr Date Count, Within 1mo Date Count, Within 1yr Date Count, Future Date Count, Date Days Present, Date Weeks Present, Date Months Present, Maximum Date, Minimum Date |
| Uniqueness | Unique, Unique Percentage | Distinct Value Count, Distinct Standard Value Count, Top Frequent Values, Distinct Value Hash, Distinct Pattern Count, Top Patterns |
| Validity | All values in List-of-values are present, Alpha Truncation, Constant Value Present, Custom Expression, Data Match, Decimal Truncation, Distinct Value Count Change, Email Format, Invalid Zip Code Format, Minimum Date, Minimum Value, Mostly Dates In String, Mostly not null/empty/filled values, Mostly Numeric In String, Mostly One Value, Pattern Match, Street Address Pattern, Suggested Data Type, Too Many Boolean Values, US State, Value present in List-of-Values | Column Name, Column Type, Data Type Suggestion, Functional Data Type, Functional Table Type, General Type, Position, Table Name, Zero Length Count, Average Length, Maximum Length, Minimum Length, Maximum Text, Minimum Text, Lead Space Count, Embedded Space Count, Average Embedded Spaces |
DataOps TestGen Architecture and Requirements
The current version of DataOps TestGen has two major components: a Docker container, which contains the software executables for the TestGen engine, and a PostgreSQL database that persists the test results, test runs, and other test information.
| Component | Role |
|---|---|
| Docker container | The software executables for the DataOps TestGen engine — profiling, test generation, and test execution. |
| PostgreSQL database | Persists test results, test runs, test definitions, and profiling results. |
| Target database connection | Snowflake or Amazon Redshift, reached with supplied connectivity and credentials. |
| Deployment | Self-hosted only. Docker Compose for evaluation, or Kubernetes with Helm and an external PostgreSQL for production. DataKitchen hosts nothing. |
Tests and profiling may be created, edited, run, and their results reviewed via a series of command line arguments:
execute_cat_tests_query,execute_tests_querygen_tests_query,profiling_queryrun_execute_cat_tests,run_execute_testsrun_generate_tests,run_get_entitiesrun_launch_db_configrun_observability_exporterrun_profiling_bridge,run_test_parameter_validation
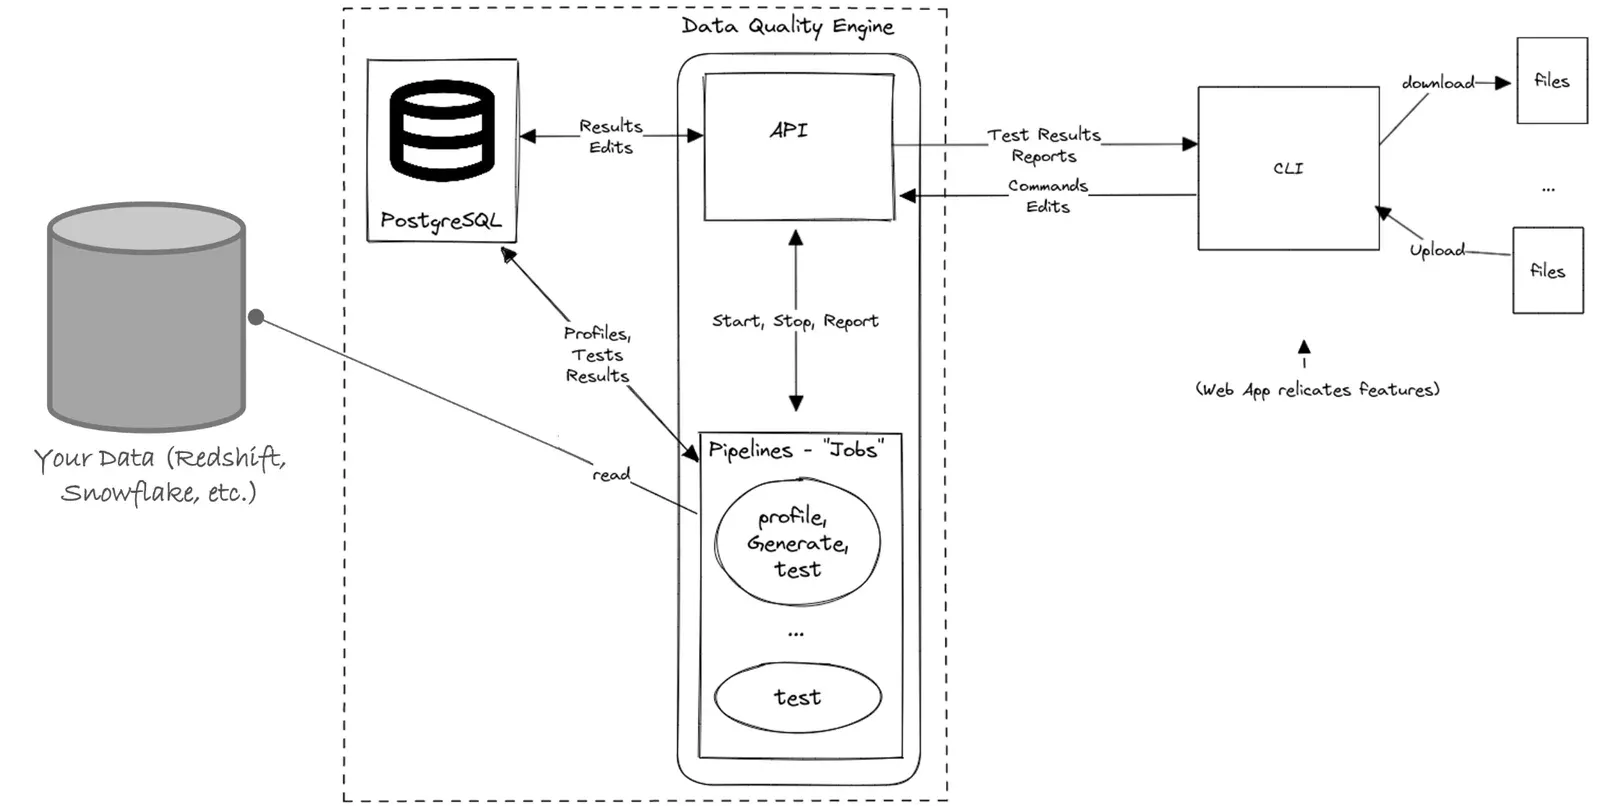
DataOps TestGen is self-hosted in your own environment; there is no DataKitchen-hosted option and no cloud metadata tier. Database connectivity and credentials are required.
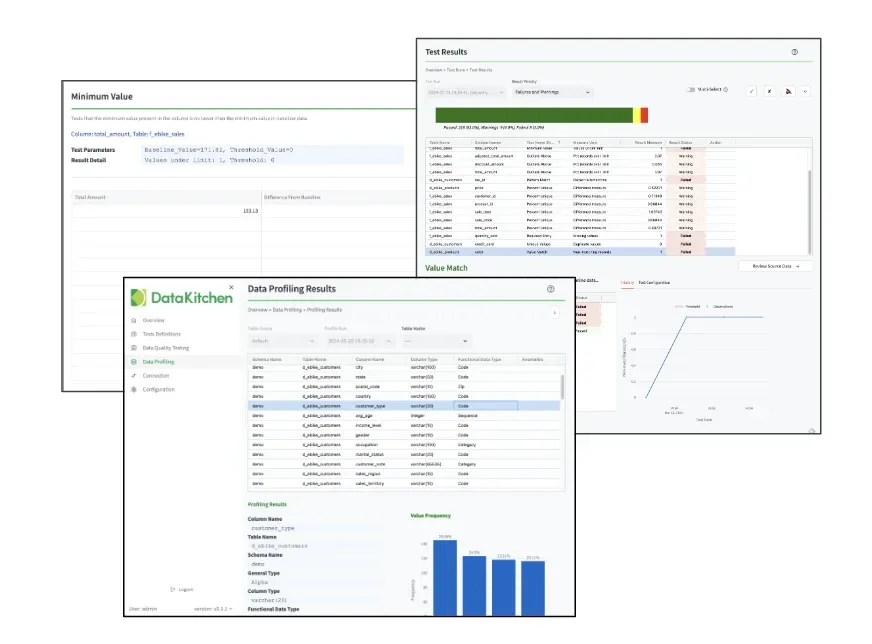
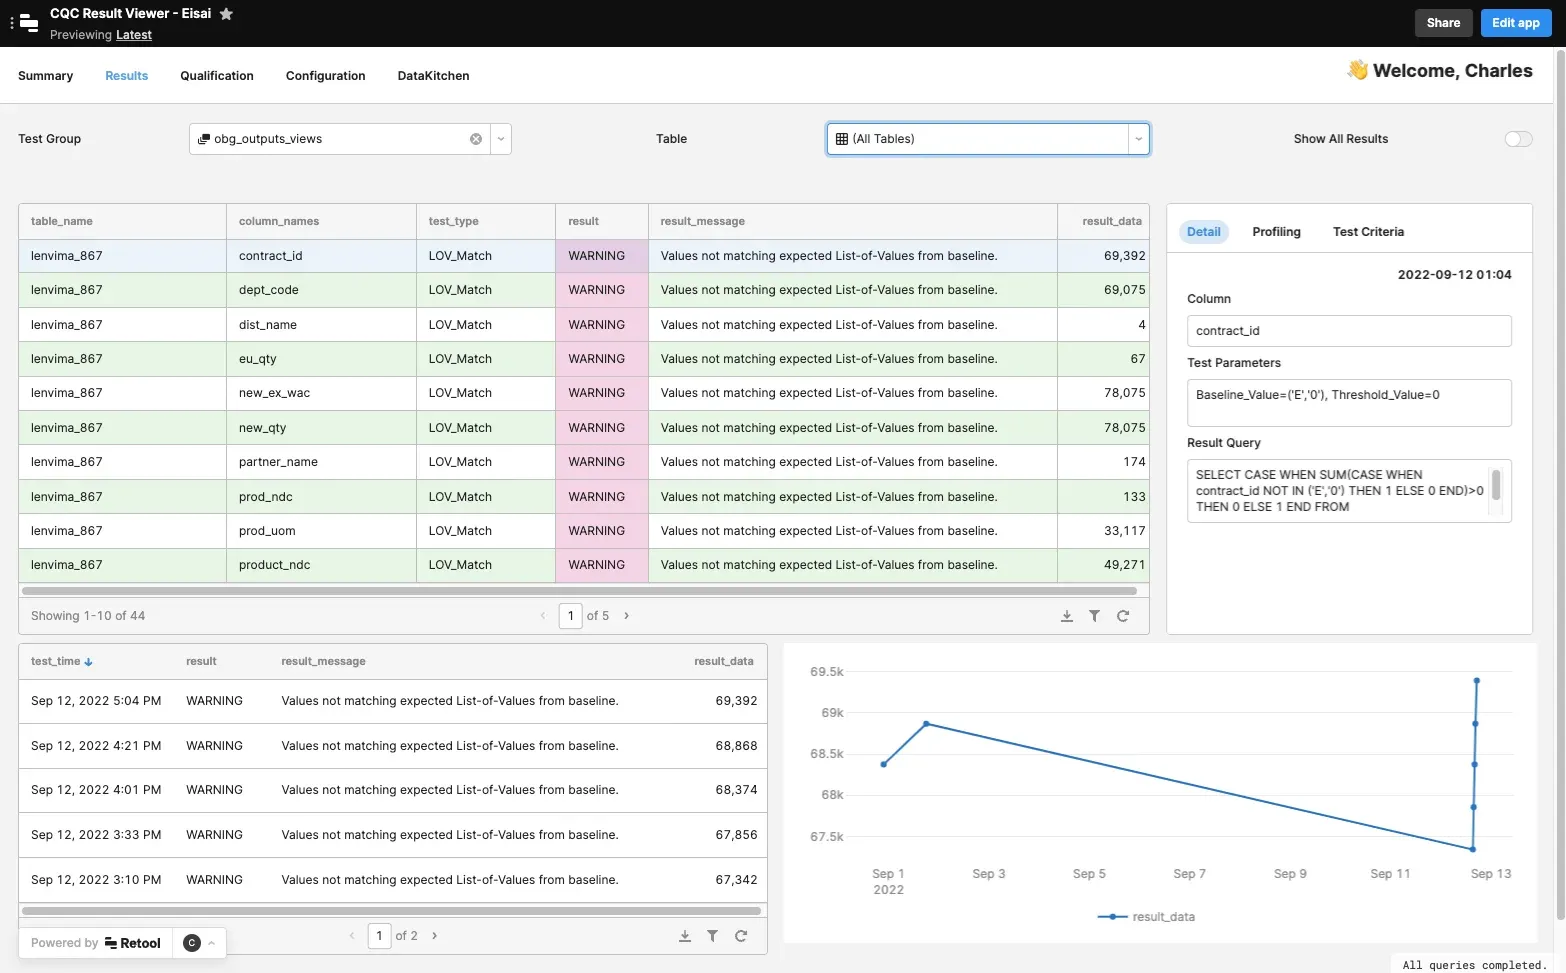
DataOps TestGen currently supports two databases: Snowflake and Amazon Redshift. Support for more databases such as Databricks, Google BigQuery, Azure Synapse, and SQL Server will be released through 2023. Later in 2023, DataOps TestGen will add a User Interface. An example of that UI is shown below.
NOTE
This paper documents the June 2023 release. DataOps TestGen has since shipped a full web user interface, become free and open source, and added support for many more databases — including Databricks, BigQuery, Azure Synapse, SQL Server, and PostgreSQL. The test and profiling inventories in this paper are the 2023 baseline; the current counts are higher. See Announcing DataOps Data Quality TestGen 3.0 and Install DataOps TestGen for what runs today.
DataOps TestGen integrates with DataOps Observability to provide a complete view of your Data Journey from data source to resulting delivery to your customer across your data toolchain.
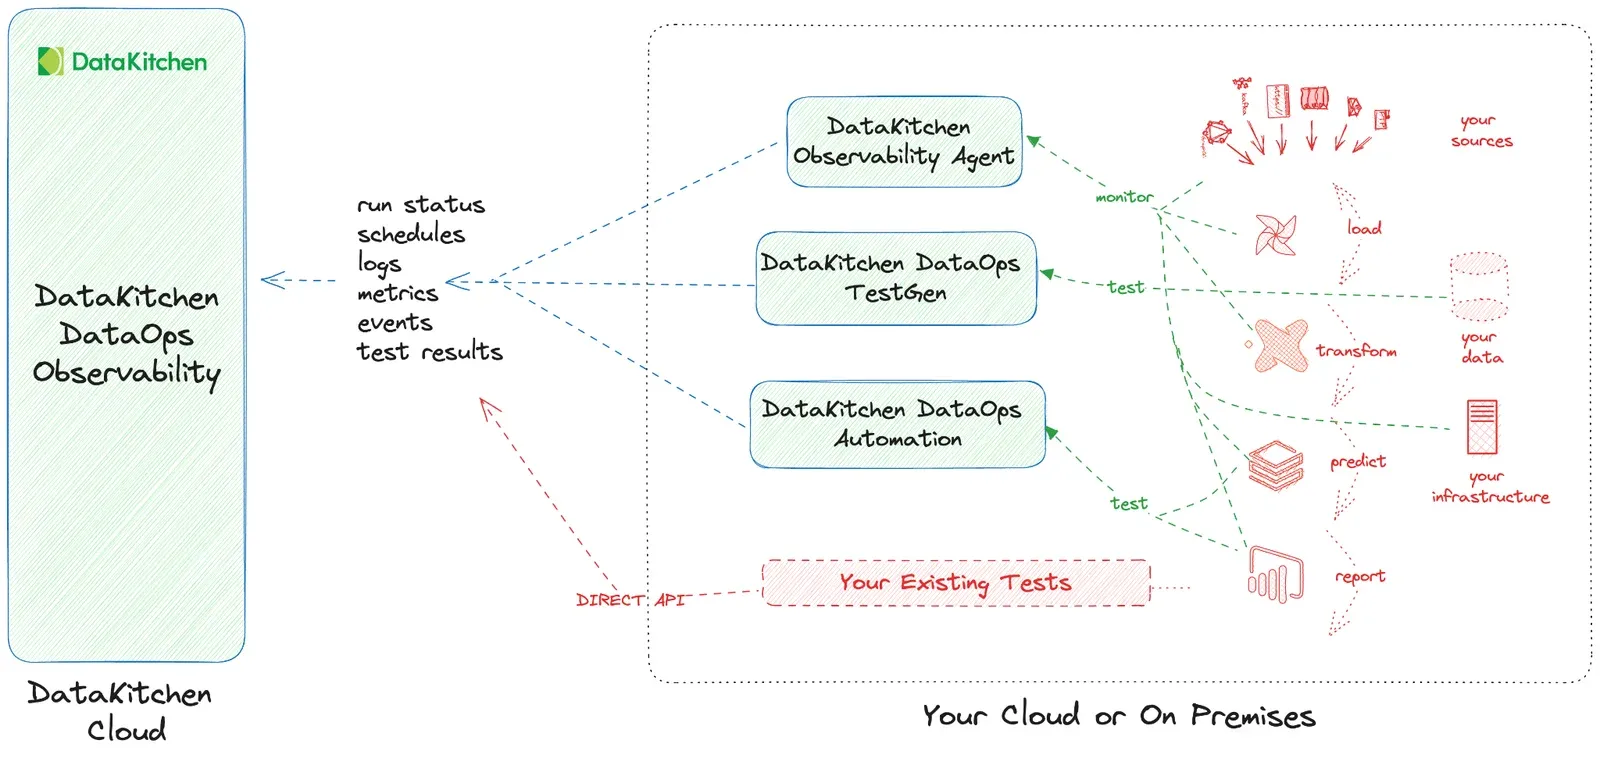
Table Monitors
Tests check content against rules. Monitors watch a table’s operational behaviour and learn what normal looks like, so nobody sets a threshold by hand. There are four types, and it is worth being precise about which part is machine learning, because the industry is loose with the word.
| Monitor | Watches | How the threshold is set |
|---|---|---|
| Freshness | Whether the table changed when it should have | Percentile distribution of observed update gaps |
| Volume | Row count movement | SARIMAX time-series model, after roughly 30 runs of training |
| Schema | Tables and columns added, dropped or altered | Structural comparison, no model |
| Metric | A numeric value you define in SQL | SARIMAX time-series model, as with Volume |
Monitors run on their own schedule, independent of test suites, typically at about twice the expected rate of data change. So a table can be watched hourly without running a full suite hourly. Thresholds can be overridden with static or historical calculations where a learned range is not wanted. Monitor documentation.
Quality Scores
Profiling and testing each produce a score, and the overall score is the product of the two. The number answers one question: what share of this data is clean.
Scorecards slice that score by more than table. Quality dimension (accuracy, completeness, consistency, timeliness, uniqueness, validity), impact dimension (conformance, regularity, reliability, usability), and organisational metadata such as business domain, stakeholder group, data source and pipeline stage all work as lenses on the same underlying results.
Scoring is weighted rather than flat, because not every column deserves equal weight. Entity tables carry a higher multiplier than transaction tables; identifier columns count for more than description columns. Multiple issues on one column combine probabilistically instead of summing, so a single bad column cannot drag a score below what the data warrants. Quality score documentation.
Data Catalog, PII and Critical Data Elements
The Data Catalog is where profiling output becomes navigable. For every table and column it holds profiling statistics, hygiene findings ranked Definite, Likely or Possible, test results, quality scores, editable descriptions, and nine categories of metadata tag including business domain, data source, transform level and data classification.
Two flags matter more than the rest. PII can be detected during profiling by matching known categories — national identifiers, card numbers, email addresses, phone numbers — and a flagged column is masked for any user whose role lacks PII access. Critical Data Element marks the data that actually matters, and a scorecard can compute a score from CDE-flagged columns alone, which is usually the number an executive wants rather than an average across everything. Data Catalog documentation.
Programmatic Access: REST API and MCP Server
Two interfaces cover the product, and between them there is nothing you can do in the interface that you cannot do from code.
The REST API covers connections, table groups, test suites, definitions, runs, results, scores, schedules and notifications. That is what makes TestGen usable from an orchestrator: call it at the point in the pipeline where the check belongs, and halt on a failure before bad data moves downstream. Airflow, Azure Data Factory, a shell step — anything that can make an HTTP request. None of it requires DataKitchen automation.
The MCP server exposes 96 tools across the whole loop and works with any MCP client, including Copilot, Claude, Claude Code and Cursor. Two details matter for a security review. It runs behind your firewall under the Apache 2.0 licence. And it authenticates the individual user over OAuth 2.1, so every call runs with that person’s role and lands in the same audit history as their interface work — an agent inherits a user’s permissions and cannot exceed them.
Access Control and Editions
Five roles govern a project: Admin (everything, including PII), Data Quality (manage table groups, run tests, disposition results, edit tags, see PII), Analyst (disposition results and edit tags, PII redacted), Business (read-only, PII redacted), and Catalog (Data Catalog only, PII redacted). Roles are assigned per project, so one person can hold different access in different projects. With SSO enabled, users are created on first login rather than by hand. User access documentation.
The open-source release is the full testing engine, not a stripped demo: profiling, generated tests, hygiene detection, monitors, scoring and dashboards, scheduling, notifications, the REST API, the MCP server and the interface. It is limited to one user, one project and one database connection.
Enterprise adds what a team needs rather than an individual: multiple users with SSO and role-based access control, multiple projects, multiple connections, PII masking, custom branding, an external PostgreSQL repository, and support. Pricing is a flat $100 per month per user and per database connection, with unlimited tables and data volume.
Security and Deployment
The architecture answers the question a security review actually asks — what leaves our environment — with: nothing.
TestGen is self-hosted. It connects to your database with read-only credentials and pushes SELECT queries into it. The database does the compute and returns aggregates: row counts, column statistics, pass and fail outcomes. No row of your data is copied into TestGen, and failing-row detail is queried on demand when someone opens a result rather than warehoused.
The repository is a PostgreSQL database running on-premise beside the application,
holding profiling statistics, test definitions, results, monitor history and scores.
There is no cloud metadata tier. DataKitchen hosts nothing and has no access to your
environment. The one outbound signal is optional anonymous usage telemetry, disabled
with TG_ANALYTICS=no, and it carries no data content.
| Area | Detail |
|---|---|
| Deployment | Docker Compose for evaluation; Kubernetes with Helm and external PostgreSQL for production |
| Containers | Alpine Linux, non-root, no privileged access required |
| Credentials at rest | AES-256-CBC for database passwords and keys |
| Passwords and sessions | bcrypt hashing; HMAC-SHA256 signed session tokens |
| Transport | HTTPS configurable in both editions |
| Release scanning | SAST, secret detection and Docker Scout on every release |
| Penetration testing | Independent, roughly every two years, against OWASP ASVS |
Architecture and security documentation.
Connectors
Databases are connected directly and tests run inside them. A flat file needs one extra step: because execution happens in the database, a CSV has to be reachable as a table first. Load it, or expose it through an external table format such as Apache Iceberg, Snowflake external tables or Redshift Spectrum. Once it is a table, TestGen profiles and tests it like any other. Connection documentation.
What DataOps TestGen Does Not Do
A technical overview that only lists strengths is a brochure. These are the boundaries, and each is a deliberate decision rather than an omission.
No issue ticketing. TestGen detects findings and records what was decided about them — dispositions, notes, and a result history that answers whether a failure is new or has been flaky for six weeks. Assignment, escalation and closure belong in Jira or ServiceNow, and a second queue nobody reads helps no one. Findings move out through the API, the MCP server, email, or DataOps Observability’s rules engine.
No data lineage. When data breaks, the useful question is usually which process ran wrong, not which column feeds which column. A column graph tells you what could be affected; it rarely tells you what happened at 2am. Process lineage lives in DataOps Observability instead.
No field-level audit log of test configuration changes. You see the current definition and who may change it, not a per-edit history with author and timestamp. On the roadmap.
No native cross-database reconciliation. See the note above; the copy-a-suite pattern works today, the built-in workflow is roadmap.
No catalog connector. There is no Alation or Open Data Quality Initiative integration shipping today. Everything such an integration needs — scores, results, profiling statistics, column metadata, hygiene findings, PII and CDE flags, dispositions, run history — is available through the API.
No root-cause explanation or remediation recommendations. That reasoning needs the context of your pipelines, tickets and code, which TestGen does not have. Its job is to be the best possible input to a tool that does, which is what the MCP server delivers.
Example DataOps TestGen Use Cases
Data Production Testing
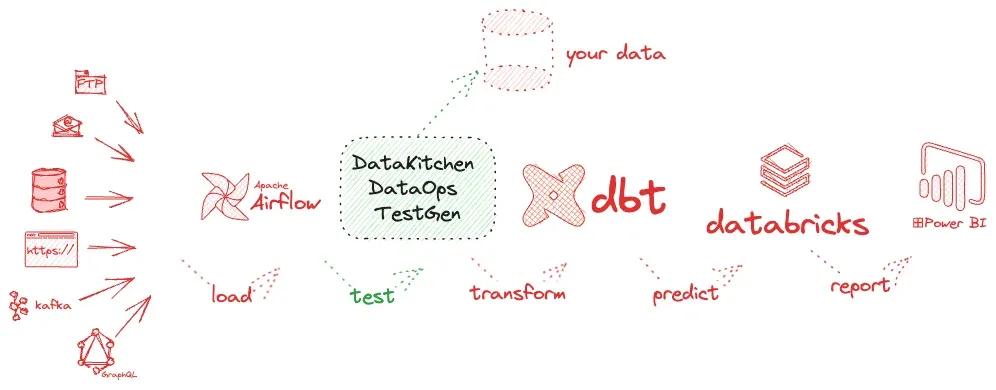
In your day-to-day analytics production, you may use various tools to load, transform, predict, and report on data. Modern data architectures often forget the most crucial part — automatically testing data during production.
Black Box ETL Testing
DataOps TestGen allows you to build credible, refinable testing when business information is limited or unreliable.
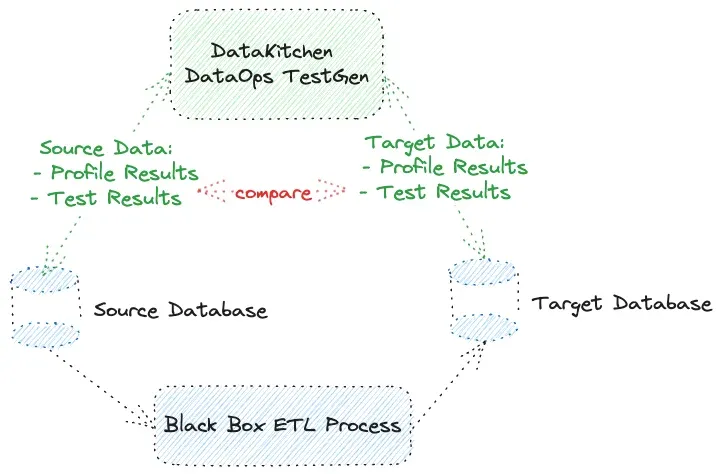
For example, you may have a legacy, black box ETL process developed long ago, with the developers reassigned or gone. You may not know the ETL process and have little or no documentation. DataOps TestGen lets you apply credible testing to dispersed, legacy data pipelines and tech stacks. It shines a light on the black box.
Understanding Distributed Data Mart Quality
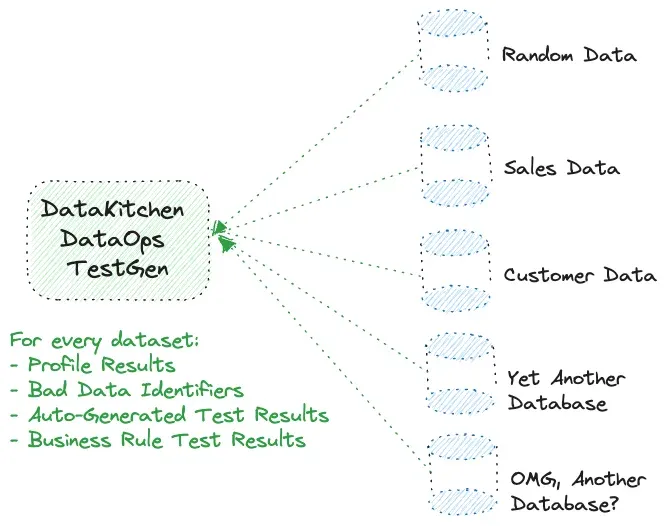
Companies often have multiple databases scattered around an organization, each containing unique and vital datasets. Data engineers are sometimes tasked with building common data standards and developing comparative data quality metrics for data across databases and servers. They can also be tasked with enforcing in-place data quality standards. DataOps TestGen spans multiple data marts and databases so you can create and enforce a common set of data rules and standards. You can also maintain a common set of data test results that can help enforce in-place data standards.
Coordinating Test Definition Development with Data Stewards and the Business
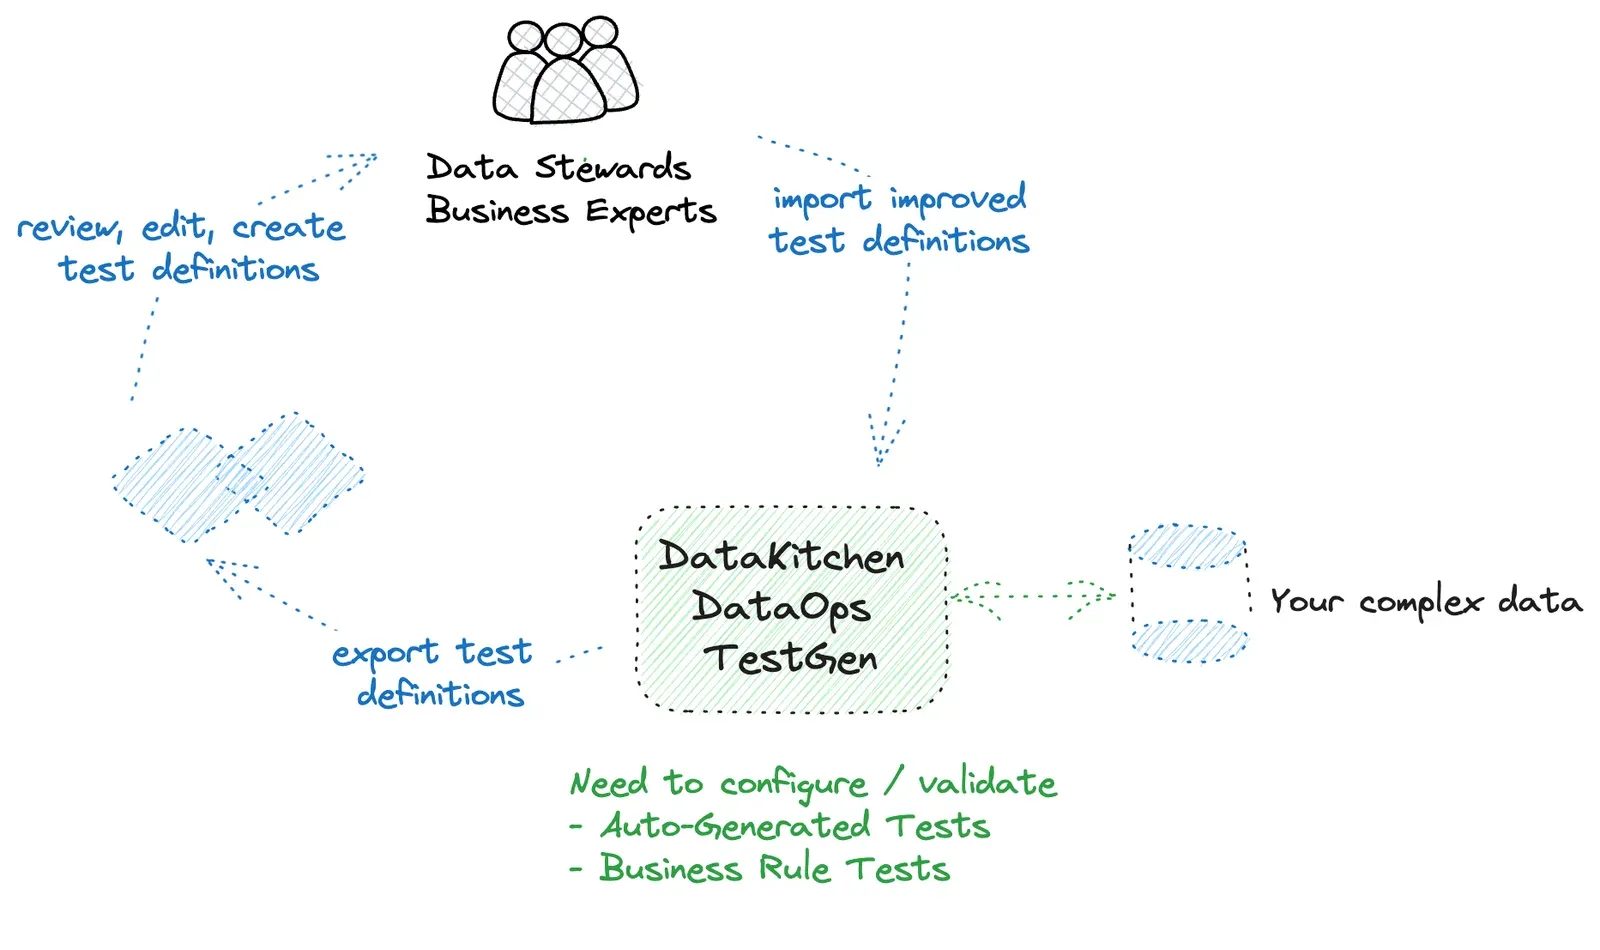
One of the big challenges data engineers have is understanding what tests are needed and configuring the parameters of those tests. That knowledge is often in the hands of business users or Data Stewards. DataOps TestGen allows you to get those individuals looped in early. You can share responsibility in editing data test definitions and configuration with people who know your business context the best. You can develop fast first-pass test specs to communicate with data stewards and SMEs. You can empower non-technical people to configure tests.
Test Individual Raw Data Sources and Give Immediate Feedback
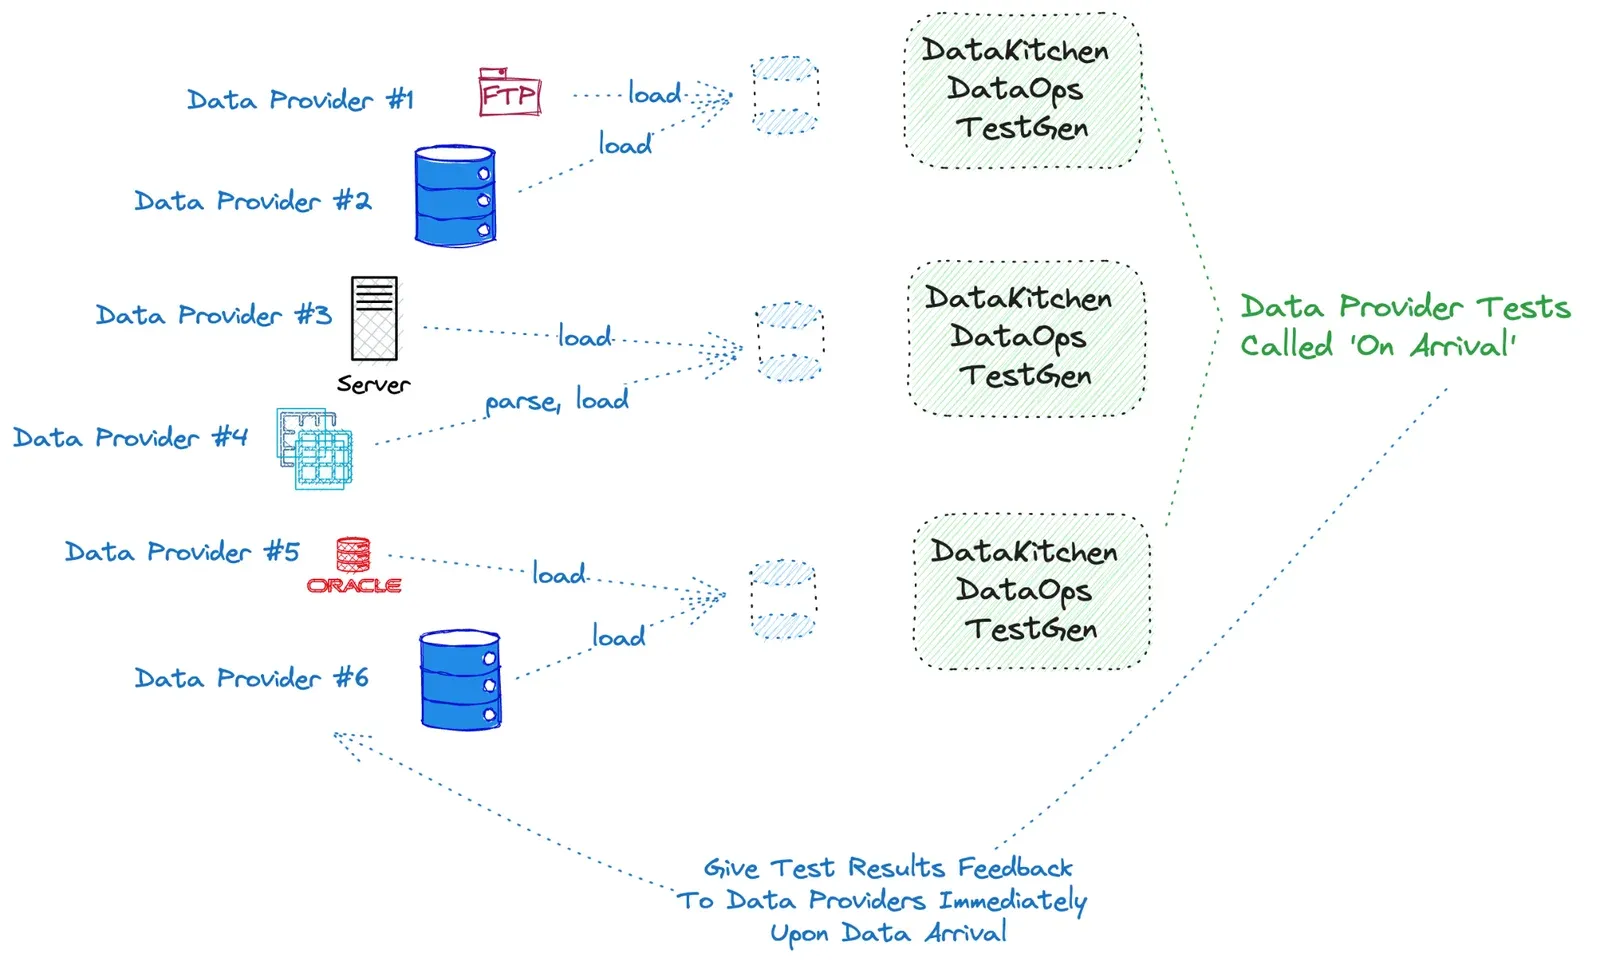
Data Engineers often have dozens — or hundreds! — of individual data providers. Many enterprises need more data tests and controls on data sources that allow data to flow through their data factory. “Hoping for the best” is not an effective manufacturing strategy. You want to catch errors as early in your process as possible. Ensure the data and artifacts you create from data are correct before you start your data integration and production process. Why? Fast feedback holds upstream data providers responsible. It prevents you from getting caught holding the bag for data errors you can’t control. DataOps TestGen allows you to screen for unanticipated problems, the unknown-unknowns in the data that comes from your many data sources. Catch the unpredictable from your data providers right away when the data lands.
Multi-Layered Database Structures
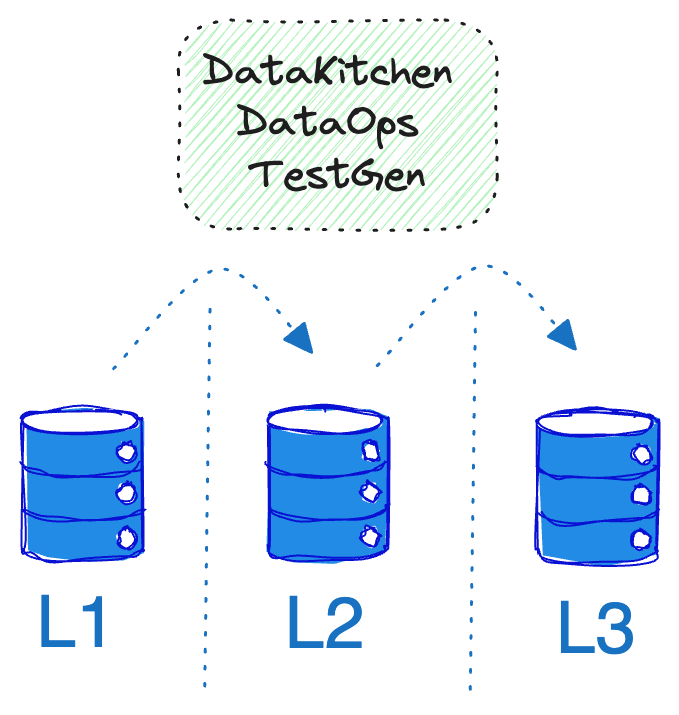
Some data teams today organize their data warehouse or lake into L1, L2, and L3 layers. The layers generally refer to different stages of data processing, storage, and access. The naming and specifics of these layers can vary somewhat depending on the context and the specific data warehousing approach, but here is a generalized description:
- L1 — Operational Data Layer (ODL): the Source layer.
- L2 — Integration Layer (IL): the Harmonization or Transformation layer. Data from different source systems are cleaned, transformed, and integrated.
- L3 — Access Layer (AL): the Presentation or Information layers. This layer is where business users interact with data, often through reporting, dashboarding, and analytics tools.
Data Teams have specific challenges in understanding and testing data in each warehouse layer. They want to ensure that each layer has not lost or mangled data during its process layers. They must ensure that data properties match business logic at each processing layer. DataOps TestGen allows you to create a test that spans each layer of the database, ensuring consistency and accuracy at each level.
DataOps TestGen As Part Of Observing Your Entire Data Journey
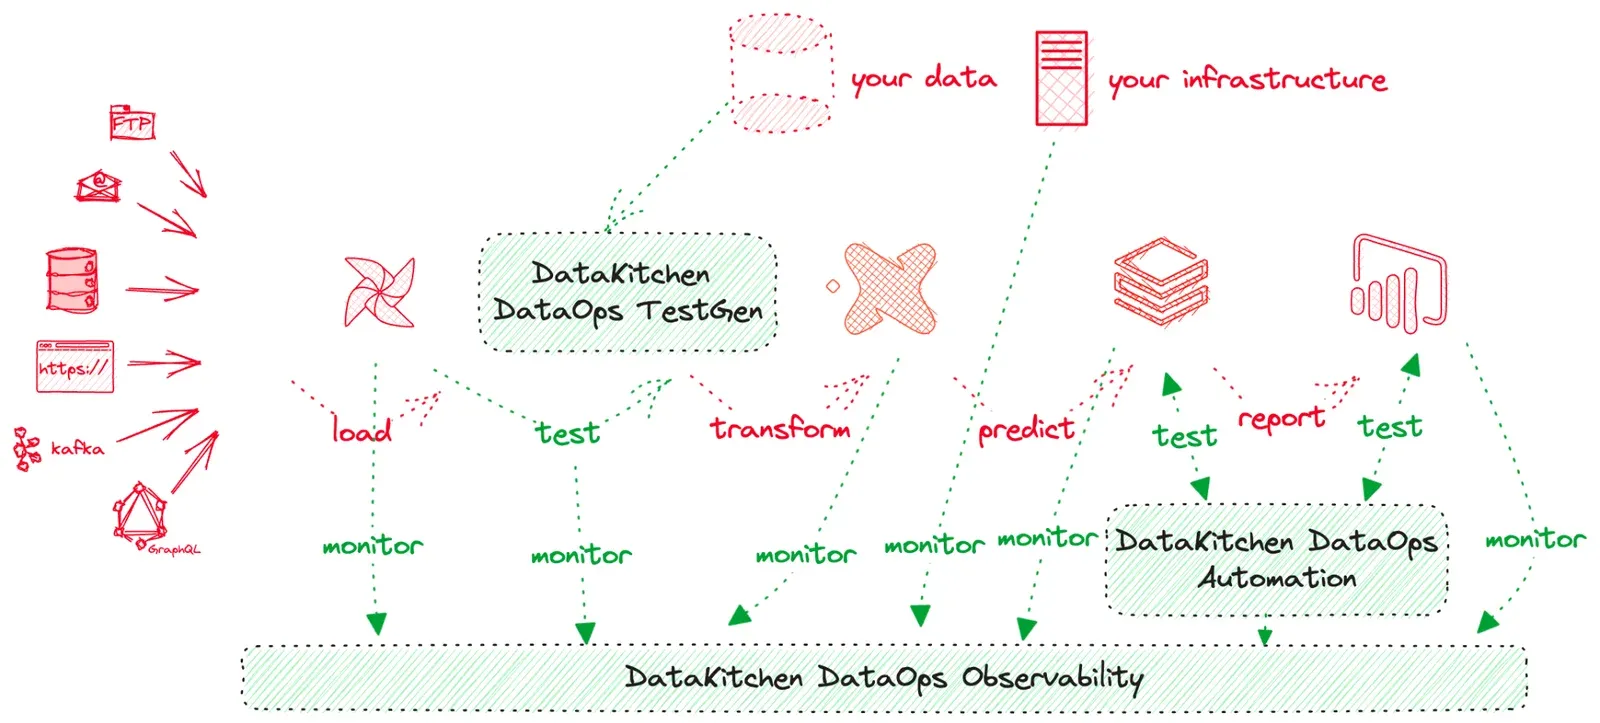
You have many data tools: Talend, Azure Data Factory, DataBricks, custom tools, custom testing tools, ETL tools, orchestrators, data science tools, dashboard tools, databases, bucket stores, servers, and more. Those tools work together to take data from its source and deliver it to your customers. We call that multi-tool process a ‘Data Journey.’ The Data Journey is about observing what you have done, not changing your existing data estate. Data Journeys track and monitor all levels of the data stack, from data to tools to servers to code to tests across all critical dimensions. It supplies real-time statuses and alerts on start times, processing durations, test results, and infrastructure events, among other metrics. With this information, you can know if everything ran on time and without errors, and immediately detect the parts that didn’t.
DataOps Observability provides the Data Journey abstraction, expectations, alerts, and analysis. DataOps TestGen provides in-database data testing results shared with DataOps Observability. DataOps Automation provides tool, model, and API-level testing shared with DataOps Observability. Their relationship is shown below.
Why DataKitchen’s DataOps TestGen?
What is the goal of DataOps TestGen? Automatically generate data quality checks that identify errors in your data before your customer finds them. Efficiently test data during the production process directly in the database. Allow data engineers to understand their data and detect problematic data records. Give data engineers room to grow from automatic data tests to a list of configurable ‘fill in the blank’ data tests that require business context.
So what makes DataOps TestGen a sustainable framework?
- Simple to use — doesn’t add complexity or clog up mental bandwidth.
- Self-documenting — encourages transparency and collaboration.
- Extensible — responds to changing needs without hard coding.
- Instantiates a plan of action — not just reporting.
- Refinable over time — separates signal from noise.
- Minimal impact on production performance.
DataKitchen is the Complete Toolkit For Testing All Aspects of Your Data Journey
Errors in production don’t just happen in your data; they can take place anywhere on the Data Journey from data source to value delivery. Data Journeys represent the myriad paths data take from source to the insight value you deliver to your customer. Data Journeys track and monitor all levels of the data stack, from data to tools to code to tests across all critical dimensions.
While DataOps TestGen focuses on the critical piece of testing data in your database, it is always important to test every step of the Data Journey:
- Test raw data.
- Test integrated data.
- Test the data changed by your tools — reports, models — acting upon data.
- Test the entire orchestrated process across all your tools and data stores from source to value.
- Test in production and development.
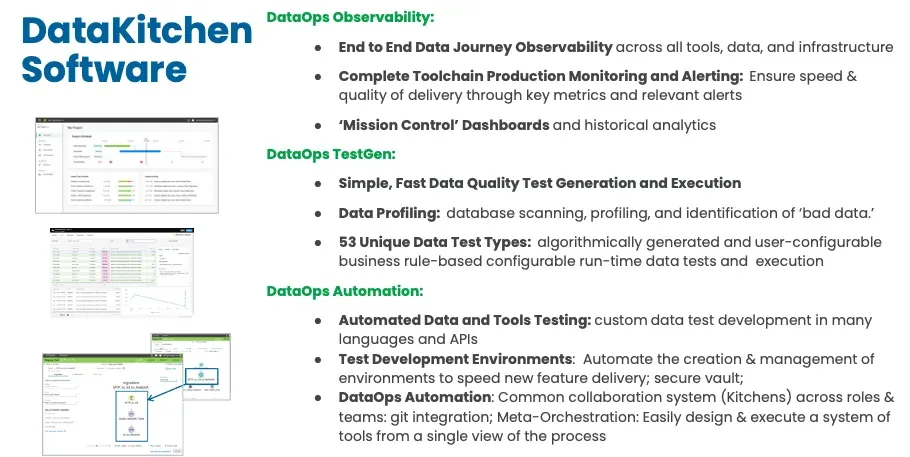
DataKitchen has a complete software solution for testing and observing every part of your Data Journey:
| Task | DataKitchen tool |
|---|---|
| Data profiling and hygiene detection | DataOps TestGen: 55 characteristics, 32 detectors |
| Automatically generated (from data profile) tests | DataOps TestGen: 33 test types |
| User configurable test templates | DataOps TestGen: 14 test types |
| Complex SQL, Python, or language containerized tests | DataOps Automation |
| Tool (ETL, BI, data science) API data testing | DataOps Automation |
| Overall Data Journey process monitoring, alerting, and analytics | DataOps Observability |
Additional Resources
- DataOps Observability – Principles and Ideas
- DataOps Observability – Technical Product Overview
- DataOps Observability and Automation Software
- DataOps TestGen Documentation
- Install DataOps TestGen today — free and open source, running on a laptop in minutes
Related Reading
- DataOps TestGen White Paper — the problem this product was built for, told as ‘the mystery box full of data errors’
- A Guide to DataOps Tests — the test taxonomy behind the generated tests
- Data Quality: The DataOps Way — the method that surrounds the tooling
- The Syntax, Semantics, and Pragmatics Gap in Data Quality Validation Testing — why generated tests can only cover the first layer
- The 2026 Open Source Data Profiling Software Landscape — where profiling tools stand now
- Scaling Data Reliability: The Definitive Guide to Test Coverage — how much testing is enough
- Test Coverage Beats Data Lineage — why a static blueprint is not a smoke detector
- The Seven Deadly Sins of Data Quality — the habits that leave databases untested
- Announcing DataOps Data Quality TestGen 3.0 — where the product went after this paper
FAQ
What is the main point of this paper?
DataOps TestGen turns a database into a tested database without anyone writing test code. It profiles every column to gather 55 baseline characteristics, runs 32 data hygiene detectors against those results, derives 33 types of data quality validation test automatically, and adds 14 configurable business rule tests for the judgements only a human can make. This paper documents each of those pieces and the architecture that runs them.
How does DataOps TestGen generate data quality tests automatically?
It derives them from profiling results. Profiling records what is actually in each column, and test generation reads those characteristics to pick appropriate rules and thresholds. Typically two to nine tests are generated per column, which can total thousands for a full schema. Generation is fast even when profiling takes time, and tests can be regenerated whenever a new baseline is wanted.
What does data profiling in DataOps TestGen measure?
It gathers 55 baseline characteristics per column, grouped into averages, column and table types and names, date characteristics, minimum and maximum values, numeric counts, percentiles, position, top frequent values and patterns, unique value counts, and zero-length or null counts. Results are stored in a standard table available for direct review and used to derive tests downstream.
How often should you run data profiling?
Weekly or monthly for most teams, and not as part of production. Profiling runs a separate query against every column of every table analysed, so it is too expensive to sit inside a production validation run. Profiling can be limited to a random percentage of records, but analysing the whole table gives the fullest picture and better derived tests.
What are data hygiene detectors?
They are 32 detectors that check how closely a column’s declared structure matches its actual contents. Examples include Invalid Zip Code Format, Leading Spaces, Mostly Dates In String, Mostly One Value, Non-standard Blank Values, Pattern Inconsistency, Potential Duplicates, Suggested Data Type, and Too Many Boolean Values. Their results guide data type corrections and patching steps before ongoing testing begins.
How many tests does DataOps TestGen generate per column?
Typically between two and nine, chosen by the characteristics found during profiling. Across a full schema that commonly totals thousands of tests. The point of that breadth is coverage of problems nobody predicted in advance, the same way a burglar alarm puts sensors on every entrance rather than guessing which window an intruder will try.
What are Business Rule Configurable Data Tests?
They are 14 test types you configure rather than code, for rules that cannot be derived from prior data. The logic is already written and verified, so setup is faster than custom SQL, and the test tables can be shared with business users rather than database programmers. Examples include Reference Match, Aggregate Balance, Distribution Shift, Row Range, Custom Condition, and Custom Test.
What multi-table tests does DataOps TestGen support?
Six, plus custom SQL. Reference Match checks a column or key set against a reference table. Aggregate Balance, Aggregate Balance Percent and Aggregate Balance Range confirm that sums and totals per group tie out against another table, such as sales dollars per product per day, exactly or within a tolerance. Aggregate Minimum checks that totals per group never fall below the matching totals in another table. Distribution Shift compares a column’s value distribution against another table or a prior version. Custom Test covers anything else you can write as a SQL query across tables.
How do DataOps TestGen tests map to the six data quality dimensions?
Every profiling characteristic and test type falls under accuracy, completeness, consistency, timeliness, validity, or uniqueness. Outlier Percentage and Incremental Average Shift serve accuracy; Row Count and Missing Percentage serve completeness; Average Shift and Prior Match serve consistency; Recency and Future Date serve timeliness; Email Format and US State serve validity; Unique and Unique Percentage serve uniqueness.
What is the DataOps TestGen architecture?
At publication it was two components: a Docker container holding the software executables for the TestGen engine, and a PostgreSQL database that persists test results, test runs, and other test information. Profiling and tests were created, edited, run, and reviewed through command line arguments. It is self-hosted in your own environment, given database connectivity and credentials. DataKitchen hosts no component of it.
What is black box ETL testing?
It is testing a pipeline nobody understands any more. A legacy ETL process may have been built years ago by developers who have since left, with little or no documentation, so no one can state what the transformation is supposed to produce. Profiling and generated tests build credible, refinable coverage from the data itself rather than from documentation that does not exist.
Can DataOps TestGen compare data quality across multiple databases?
Yes. Companies often have data marts scattered around the organisation, each holding unique and vital datasets. TestGen spans multiple data marts, databases, and servers, so one common set of data rules and standards can be created and enforced across them, with a common set of test results to support comparative data quality metrics.
How do DataOps TestGen, DataOps Automation, and DataOps Observability divide the work?
TestGen covers data profiling, bad data detection, and generated in-database tests. DataOps Automation covers complex SQL, Python, or containerised tests and tool-level API testing against ETL, BI, and data science platforms. DataOps Observability collects results from both, monitors the whole Data Journey, sets expectations, and raises alerts when reality diverges from them.
What data leaves my environment when DataOps TestGen runs?
Nothing. TestGen is self-hosted, connects with read-only credentials, and pushes SELECT queries into your database. The database computes and returns aggregates — row counts, column statistics, pass and fail outcomes. Its PostgreSQL repository runs on-premise beside the application, so there is no cloud metadata tier. The only outbound signal is optional anonymous telemetry, disabled with TG_ANALYTICS=no.
What is the difference between the open source and Enterprise editions?
Open source is the full testing engine, not a stripped demo: profiling, generated tests, hygiene detection, monitors, scoring, scheduling, notifications, the REST API, the MCP server and the interface. It is limited to one user, one project and one database connection. Enterprise adds multiple users with SSO and role-based access control, multiple projects and connections, PII masking and support.
What can the MCP server do, and is it safe to give an agent access?
It exposes 96 tools spanning the whole data quality loop and works with any MCP client, including Copilot, Claude and Cursor. It runs behind your firewall under the Apache 2.0 licence. It authenticates the individual user over OAuth 2.1, so every call runs with that person’s role and is recorded in the same history as their interface work. An agent inherits a user’s permissions and cannot exceed them.
What are table monitors, and which part is machine learning?
Monitors watch a table’s behaviour rather than its content, and learn normal from run history. There are four: freshness, volume, schema and metric. Volume and metric use a SARIMAX time-series model after roughly 30 training runs. Freshness uses the percentile distribution of observed update gaps. Schema is a structural comparison with no model. Test generation itself is algorithmic and deterministic.
How is the data quality score calculated?
Profiling and testing each produce a score and the overall score is the product of the two, answering what share of the data is clean. Scoring is weighted rather than flat: entity tables count for more than transaction tables, identifier columns for more than description columns, and multiple issues on one column combine probabilistically instead of summing. Scorecards slice the same results by dimension, domain or pipeline stage.
What does DataOps TestGen not do?
It does not do issue ticketing with assignment and escalation, which belongs in Jira or ServiceNow. It does not do data lineage; process lineage lives in DataOps Observability instead. It has no field-level audit log of test configuration changes, no shipped catalog connector, no native cross-database reconciliation yet, and no root-cause or remediation recommendations. Each boundary is a decision rather than an omission.
Get the PDF
The full paper is on this page. Fill in the form for a PDF copy to keep or share.