Why Customer Analytics Falls Behind the Market
Companies increasingly look to customer and market analytics to drive growth strategies. As the leader of the data-analytics team, you manage a group responsible for supplying sales, marketing and other business partners with the analytic insights that can create a competitive edge.
Customer and market opportunities evolve quickly and drive a relentless series of questions. Analytics, by contrast, move slowly, constrained by development cycles, limited resources and brittle IT systems. The gap between what sales needs and what IT can provide can be a source of conflict and frustration. Inevitably this mismatch between expectations and capabilities can cause dissatisfaction, leaving the data-analytics team in an unfortunate position and preventing a company from fully realizing the strategic benefit of its data.
Seven Challenges of Customer Analytics
As a manager overseeing analytics, it’s your job to understand and address the factors that prevent the data-analytics team from achieving peak levels of performance. If you talk to your team, they will tell you exactly what is slowing them down. You’ll likely hear variations of the following seven challenges.
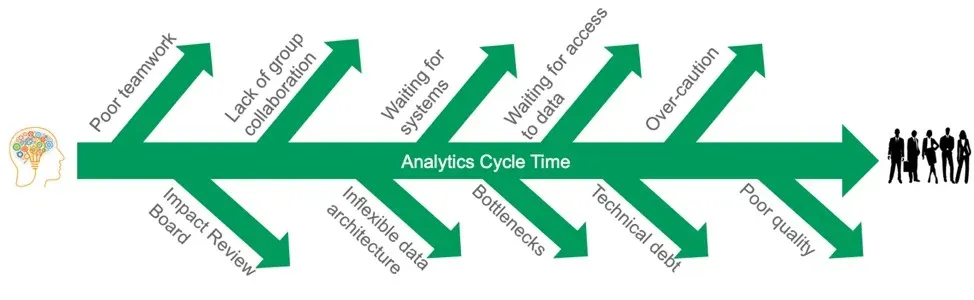
1. The Goalposts Keep Moving
Sales and marketing are demanding customers for a data-analytics team. Their requirements change constantly. They require immediate responses, and no matter how much the analytics team delivers, sales and marketing keep generating new requests. It’s enough to overwhelm any data-analytics team.
They don’t know what they want. Sales and marketing professionals are not data experts. They don’t know what insights are possible until someone from your team shows them. Sometimes they don’t know what they want until after they see it in production, and maybe not even then. Often, sales and marketing contributors do not know what they will need next week, let alone next quarter or next year. It’s not their fault. It’s the nature of pursuing customers in a fast-paced marketplace.
They need everything ASAP. Sales and marketing are competitive endeavors. When a customer opportunity opens, they need to move on it faster than the competition. When sales and marketing bring a question to the data-analytics team, they expect an immediate response. They can’t wait weeks or months. The opportunity will close as customers seek alternative solutions.
The questions never end. Sometimes providing business stakeholders with analytics generates more questions than answers. Analytic insights enable sales and marketing to understand customers in new ways. This spurs creativity, which leads to requests for more analytics. A healthy relationship between the analytics and sales teams will foster a continuous series of questions that drive demand for new analytics. However, this relationship can sour quickly if the delivery of new analytics can’t meet time frames required by sales and marketing.
2. Data Lives in Silos
In pursuit of business objectives, companies interact with customers across a multitude of channels and collect an enormous amount of data: orders, deliveries, returns, website page views, mobile app navigations, downloads, clicks, metrics, audio logs, social media and more. Further, this data can be combined with demographic, psychographic or other third party market data. All of this data is collected in separate ERP, MRP, CRM, marketing automation, web analytics, call center platforms and other systems. Typically, none of these systems talk to each other. They are implemented in a variety of databases and on different software platforms. They utilize numerous APIs and technologies. Accessing all of this data is a daunting task requiring such a wide range of skills that it is rare to find a single person that can do it all. Integrating data from these myriad sources becomes a major undertaking.
Sales and marketing want fast answers. Meanwhile, the data-analytics team has to work with IT to gain access to operational systems, plan and implement architectural changes, and develop/test/deploy new analytics. This process is complex, lengthy and subject to numerous bottlenecks and blockages.
3. Data Formats Are Not Optimized
Data in operational systems is usually not structured in a way that lends itself to the efficient creation of analytics. For example, an ERP system might have a schema that is optimized for inserts, updates, and for display in a web user interface. For operational systems, these are the actions that need to happen in real time.
A database optimized for data analytics is structured to optimize reads and aggregations. It’s also important for the schema of an analytics database to be easily understood by humans. For example, the field names would be descriptive of their contents and data tables would be linked in ways that make intuitive sense.
4. Data Errors
Whether your data sources are internal or from external third parties, data will eventually contain errors. Data errors can prevent your data pipeline from flowing correctly. Errors may also be more subtle such as duplicate records or individual fields that contain errors. Data errors could be caused by a new algorithm that doesn’t work as expected, a database schema change that broke one of your feeds, an IT failure or many other possibilities. Data errors can be difficult to trace and resolve quickly.
5. Bad Data Ruins Good Reports
When data errors work their way through the data pipeline into published analytics, internal stakeholders can become dissatisfied. This causes unplanned work, which diverts your key contributors from the highest priority projects. Bad data also harms the hard-won credibility of the data-analytics team. If business colleagues repeatedly see bad data in analytics reports, they might learn not to trust or value the work product of the data-analytics team.
6. Data Pipeline Maintenance Never Ends
Data-analytics is a pipeline process that executes a set of operations and attempts to produce a consistent output at a high level of quality. Every new or updated data source, schema enhancement, analytics improvement or other change triggers an update to the pipeline. The data-analytics team is continuously making changes and improvements to the data pipeline. Each one of these changes must be made carefully so that it doesn’t break operational analytics. The effort required to validate and verify changes often takes longer than the time required to create the changes in the first place. You may not realize it, but your analysts, data scientists and engineers may be spending 80% of their time updating, maintaining and assuring the quality of the data pipeline. This is necessary work, but much of it is behind the scenes and unappreciated when viewed against the growing backlog of new requests from sales and marketing.
7. Manual Process Fatigue
Data integration, cleansing, transformation, quality assurance and deployment of new analytics must be performed flawlessly day in and day out. The data-analytics team may have automated a portion of these tasks, but some teams perform numerous manual processes on a regular basis. These rote procedures are error-prone, time-consuming and tedious.
Further, manual processes can also lead to high employee turnover. Many managers have watched high-performing data-analytics team members burn out due to having to repeatedly execute manual data procedures. Manual processes strain the productivity of the data team in numerous ways.
A New Approach to Customer Analytics
If you have managed an analytics team for any period of time, you have likely encountered these and similar challenges. However, you don’t have to accept the status quo. It is possible to implement processes and methodologies that address these challenges and enable your data-analytics team to improve their productivity by an order of magnitude while achieving a higher level of data quality. In this new approach to customer and market analytics, the data-analytics team executes at previously unimaginable speed, efficiency and quality.
Rapid-Response Analytics
The sales and marketing team will continue to demand a never-ending stream of new and changing requirements, but the data-analytics team will delight your sales and marketing colleagues with rapid responses to their requests. New analytics will inspire new questions that in turn drive new requirements for analytics. The feedback loop between analytics and sales/marketing will iterate so quickly that it will infuse excitement and creativity throughout the organization. This will lead to breakthroughs that vault the company to a leadership position in its markets.
Data Under Your Control
Data from all of the various internal and external sources will be integrated into a consolidated database that is under the control of the data-analytics team. Your team will have complete access to it at all times, and they will manage it independently of IT using their preferred tools. With data under its control, the data-analytics team can modify the format and architecture of data to meet its own operational requirements.
Impeccable Data Quality
As data flows through the data-analytics pipeline, it will pass through tests and filters that ensure that it meets quality guidelines. Data will be monitored for anomalies 24x7, preventing bad data from ever reaching sales and marketing analytics. You’ll have a dashboard providing visibility into your data pipeline with metrics that delineate problematic data sources or other issues. When an issue occurs, the appropriate member of your team will be alerted, and the problem will be fixed before it ever receives visibility. As the manager of the data-analytics team, you’ll spend far less time in uncomfortable meetings discussing issues and anomalies related to analytics.
Automated Efficiency
Data feeds and new analytics will be deployed using automation, freeing the data-analytics team from tedious manual processes. The analytics team will be able to focus on its highest priorities: creating new analytics for sales and marketing that create value for the company.
The processes, methodologies and tools required to realize these efficiencies combine two powerful ideas: the Customer Data Platform (CDP) and a revolutionary new approach to analytics called DataOps. Below we’ll explain how you can implement your own DataOps-powered CDP that improves both your analytics cycle time and data-pipeline quality by 10X or more.
Customer Data Platform
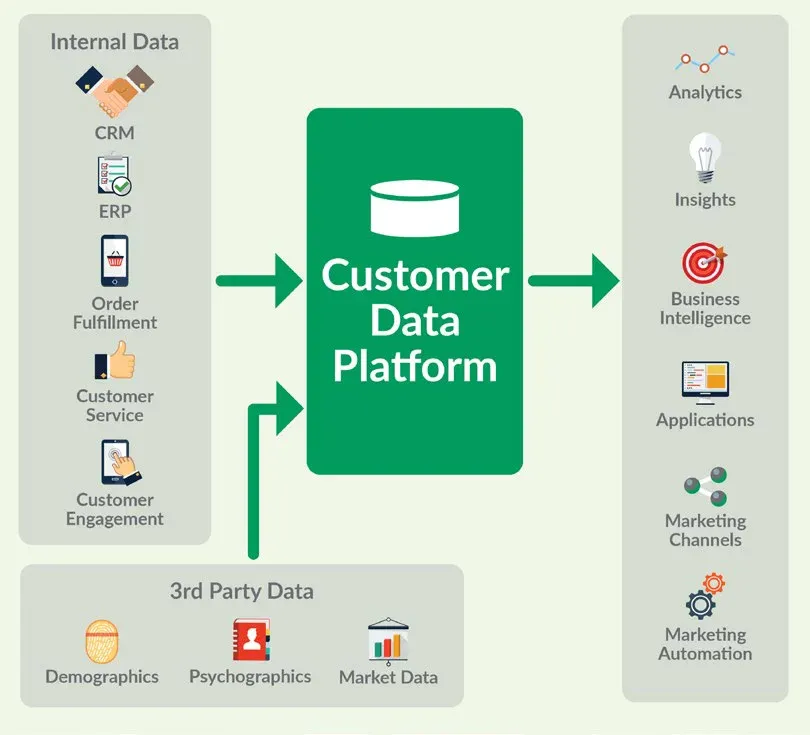
A Customer Data Platform (CDP) provides sales and marketing with a unified view of all customer-related data whether internal or external, in a single integrated database. Once setup, a CDP enables the analytics team to create and manage customer data themselves, without reliance upon resources from IT or other departments. This helps sales and marketing better leverage the company’s valuable data while responding to market demands quickly and proactively. Figure 1 shows how a CDP consolidates data from numerous databases. Each operational database becomes a data source that continuously feeds a copy of its data into a centralized CDP database.
DataOps
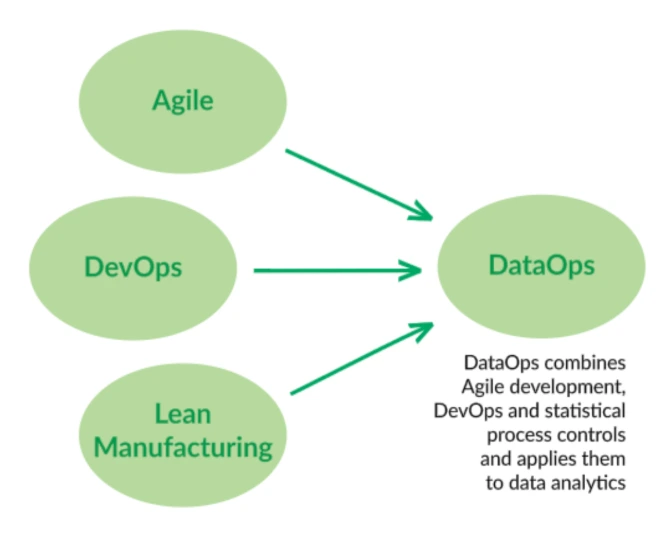
A CDP is a step in the right direction, but it won’t provide much improvement in team productivity if the team continues to rely on the same cumbersome processes and procedures to create analytics. DataOps is a set of methodologies and tools that will help you optimize the processes by which you create analytics, manage the data-analytics pipeline and automatically deploy new analytics and data. DataOps rests on three foundational principles.
Agile Development
DataOps utilizes a methodology called Agile Development to minimize the cycle time for new data analytics. Studies show that software development projects using Agile complete significantly faster and with far fewer defects.
DevOps
In DataOps, new analytics production is automated and monitored. Automated tests verify new analytics before publishing them to sales and marketing users. This allows the analysts to focus less on the mechanics of deploying analytics and more on the creation of new insights that address sales and marketing requests. In the software development domain, the automated deployment of code is called DevOps. Prominent software industry leaders use DevOps to publish software updates many times per second while assuring quality. DataOps incorporates DevOps methods and principles to publish new analytics and data in an automated fashion.
Statistical Process Control
DataOps employs a methodology called Statistical Process Control (SPC) to assure data quality using end-to-end data pipeline automation and quality controls. SPC is a lean manufacturing method that institutes continuous testing on data flowing from sources to users, ensuring that data stays within statistical limits and remains consistent with business logic. SPC monitors data and verifies it 24x7. If an anomaly occurs, SPC notifies the data-analytics team via an automated alert. This reduces the operational burden on team members while improving data quality and reliability. Also, the quantity of data and the number of data sources can more easily scale independently of the size of the data engineering team.
When implemented in concert, Agile, DevOps and SPC take the productivity of data-analytics professionals to a whole new level. DataOps will help you get the most out of your data, human resources and integrated CDP database.
Implementing a DataOps-Powered CDP
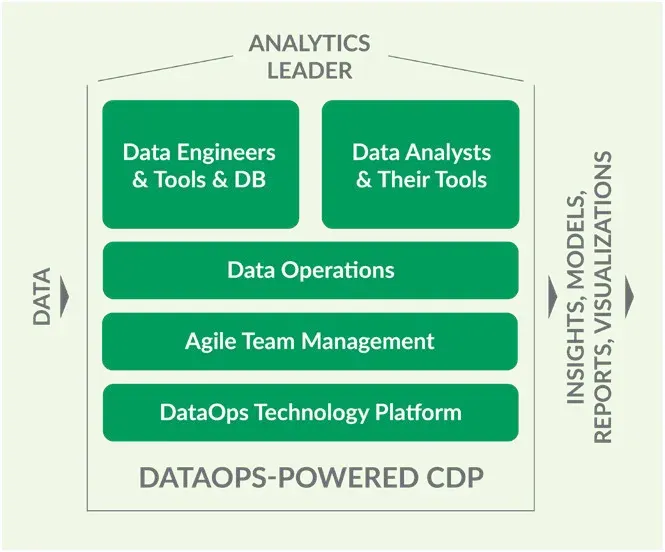
As the leader of a data-analytics organization, your mission is to utilize data from various sources to create insights that help the organization achieve its objectives. Figure 2 provides a conceptual view of this flow. The dark green boxes show the domain that is under the control of the analytics leader. The stack includes people, tools, technologies and processes that together comprise the DataOps-powered CDP.
Data Analysts and Their Tools
The Data Analyst works to satisfy the needs of the sales and marketing department by continually delivering insights. The data analyst creates visual representations of data to communicate information in a way that leads to insights either on an ongoing basis or by responding to ad-hoc questions. With a DataOps-powered CDP, data analysts work with autonomy and speed, drawing analytics from CDP data. Analysts use tools like Tableau and Alteryx to create these insights and independently promote their investigative work into production deliverables as needed.
Every resource, technology and tool in the data-analytics organization exists to support the data analyst’s ability to serve Sales and Marketing. All of the above also applies to Data Scientists who also deliver insights directly to Sales and Marketing colleagues.
Data Engineers and Their Tools and Databases
The Data Engineer works with the IT department and all data source providers to institute automated processes that move data from various data sources into a trusted, integrated CDP database under the complete control of the data-analytics team. The CDP database may include a data lake, which provides revision history, easy access, control and error recovery.
The engineer writes transforms that operate on the data lake, creating data warehouses and data marts used by data analysts and scientists. The data engineer also implements tests that monitor data at every point along the data-analytics pipeline assuring a high level of quality.
The data engineer lays the groundwork for other members of the team to perform analytics without having to be operations experts. With a dedicated data engineering function, DataOps provides a high level of service and responsiveness to the data-analytics team.
Data Operations
The DataOps-powered CDP provides automated support for the creation, monitoring and management of the end-to-end data pipeline. This includes stewardship of every aspect of the journey from data sources to reporting. SPC data-quality tests monitor each stage of the automated pipeline, alerting data engineering when data fails to meet statistical controls or business logic.
With tests monitoring each stage of the automated data pipeline, DataOps can produce a dashboard showing the status of the pipeline. The DataOps dashboard provides a high-level overview of the end-to-end data pipeline. Is any data failing quality tests? What are the error rates? Which are the troublesome data sources? With this information at his or her fingertips, the Data Engineer can proactively improve the data pipeline to increase robustness. In the event of a high-severity data anomaly, an alert is sent to the Data Engineer who can take steps to protect production analytics and work to resolve the error. If the anomaly relates to a data supplier, data engineering can work with the vendor to drive the issue to resolution. Workarounds and data patches can be implemented as needed with information in release notes for users. In many cases, errors are resolved without the users (or the organization’s management) ever being aware of any problem.
Agile Team Management
The Agile methodology governs the creation of new analytics, producing a steady stream of valuable innovations and improvements to analytic insights in short increments of time. Agile is particularly effective in environments where requirements are quickly evolving, a situation all too familiar to data-analytics professionals. Agile development is not only a method; it is also a philosophy and a mindset. Developers collaborate with sales/marketing customers, respond to change, measure progress through “delivered analytics,” release frequently, seek feedback on releases, and adjust behavior to become more effective.
DataOps Platform
The various methodologies, processes, people (and their tools) and the CDP analytics database are tied together cohesively using a technical environment called a DataOps Platform. The DataOps Platform includes support for:
- Agile project management
- Deployment of new analytics
- Execution of the data pipeline (orchestration)
- Integration of all tools and platforms
- Management of development and production environments
- Source-code version control
- Testing and monitoring of data quality
- Data Operations reporting and dashboards
The high degree of automation offered by DataOps eliminates a great deal of work that has traditionally been done manually. This frees up the team to create new analytics requested by stakeholder partners.
A DataOps Platform is not a one-size-fits-all tool. It is the central application that coordinates the various tools that drive your orchestration, testing, deployment, model deployment, development-environment management, change management, and data integration. You can create your own DataOps Platform from scratch, although partnering with a supplier can reduce time to market. Working with a partner also gives you the option of treating the entire CDP and data pipeline as a managed service, which can be initially outsourced and then partly or entirely taken over by internal resources at a later time.
The DataKitchen DataOps-CDP Solution
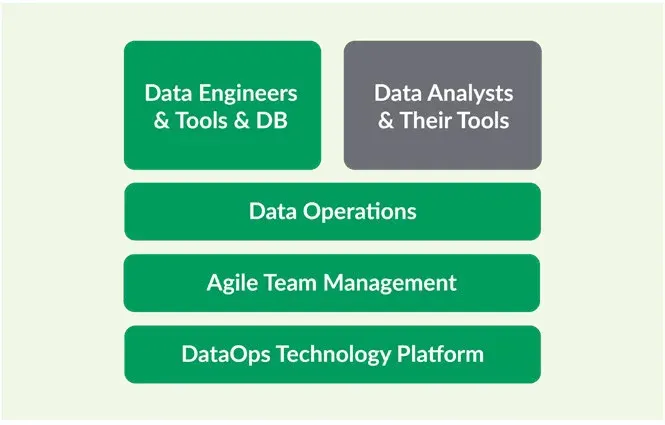
An enterprise can outsource data engineering, databases, data operations, agile team management and the DataOps Technology Platform to gain efficiencies. DataKitchen offers a DataOps Technology Platform as well as the managed services for each of the dark green boxes in Figure 3. In essence, DataKitchen offers all aspects of the DataOps-powered CDP except for data analysis and data science, which rely upon vertical market expertise and close collaboration with sales and marketing.
The enterprise can also outsource the functions shown initially, but insource them at a later date. Once set-up, the DataOps Platform can be easily and seamlessly transitioned to an internal team.
Conclusion
Customer Data Platforms promise to drive sales and improve the customer experience by unifying customer data from numerous disjointed operational systems. As a leader of the analytics team, you can take control of sales and marketing data by implementing efficient analytics-creation and deployment processes using a DataOps-powered CDP. A DataOps platform makes analytics responsive and robust. This enables your data analysts and scientists to rise above the bits and bytes of data operations and focus on new analytics that create value for the organization.
TIP
For more information on DataOps, download our free book, The DataOps Cookbook. To put the testing side of this paper into practice today, install open source DataOps TestGen.
Related Reading
- What is DataOps? — the methodology this paper applies to customer and market analytics
- DataOps Is Not Just DevOps for Data — why automating code deployment alone doesn’t fix a data pipeline
- 7 Steps to Implement DataOps — the practical build order for the platform described here
- Data Quality: The DataOps Way — the testing and SPC side of this paper in depth
- Reducing Organizational Complexity with DataOps — the companion paper on why the analytics team’s pipelines look the way they do
- A Guide to DataOps Tests — what to test at each stage of the pipeline feeding a CDP
- Gartner: 3 Ways to Deliver Customer Value Faster with DataOps — the same argument from an analyst’s seat
- Accelerating Analytic Cycle Time with DataOps — the metric sales and marketing actually feel
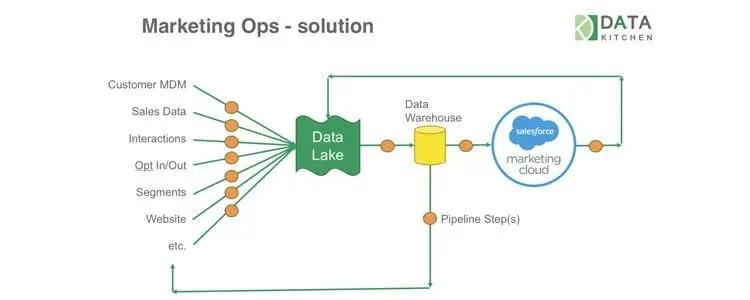
- Automated Efficiency and Quality with DataKitchen — the marketing-ops pipeline in the figure above, in detail
- Two Downs Make Two Ups — errors down and cycle time down as the only two metrics that matter
- Why DataOps Matters in the Data Value Chain — where analytics sits between raw data and revenue
- Stop Paying the Data Quality Tax — what the 80% maintenance figure costs a team each year
FAQ
What is the main point of this paper?
A Customer Data Platform unifies customer data, but it does not make the analytics team faster on its own. Adding DataOps to a CDP is what changes the outcome: Agile development, automated deployment, and Statistical Process Control together improve analytics cycle time and data-pipeline quality by 10X or more, so sales and marketing get answers while the opportunity is still open.
What is a Customer Data Platform?
A Customer Data Platform provides sales and marketing with a unified view of all customer-related data, whether internal or external, in a single integrated database. Each operational database becomes a data source that continuously feeds a copy of its data into a centralized CDP database. Once set up, the analytics team creates and manages customer data itself, without relying on IT.
Why isn’t a Customer Data Platform enough on its own?
A CDP is a step in the right direction, but it won’t improve team productivity much if the team continues to rely on the same cumbersome processes and procedures to create analytics. The database gets better while the cycle time stays the same. DataOps optimizes the processes by which analytics get created, managed, tested, and deployed.
What are the seven challenges of customer analytics?
The goalposts keep moving as sales and marketing requirements change constantly. Data lives in silos across ERP, CRM, marketing automation, and web analytics systems. Data formats are not optimized for analytics. Data contains errors. Bad data ruins good reports. Data pipeline maintenance never ends. Manual processes are error-prone, tedious, and drive turnover.
What are the three foundational principles of DataOps?
Agile Development minimizes the cycle time for new data analytics, and studies show Agile projects complete significantly faster with far fewer defects. DevOps automates and monitors analytics production, so automated tests verify new analytics before publishing. Statistical Process Control institutes continuous testing on data flowing from sources to users, verifying it 24x7.
What is Statistical Process Control in a data pipeline?
Statistical Process Control is a lean manufacturing method that institutes continuous testing on data flowing from sources to users, ensuring the data stays within statistical limits and remains consistent with business logic. If an anomaly occurs, SPC notifies the data-analytics team via an automated alert. That reduces the operational burden while improving data quality and reliability.
How much of a data team’s time goes to pipeline maintenance?
Analysts, data scientists, and engineers may be spending 80% of their time updating, maintaining, and assuring the quality of the data pipeline. Every new data source, schema enhancement, or analytics improvement triggers a pipeline update, and validating a change often takes longer than making it. The work is necessary, but it is behind the scenes and unappreciated.
What is in a DataOps-powered CDP stack?
Five layers sit under the analytics leader: data engineers with their tools and databases, data analysts with their tools, data operations, agile team management, and a DataOps technology platform. Data flows in on one side, and insights, models, reports, and visualizations flow out the other. Everything in the stack exists to support the analyst’s ability to serve sales and marketing.
What does the data engineer do in a DataOps-powered CDP?
The data engineer works with IT and all data source providers to institute automated processes that move data into a trusted, integrated CDP database under the analytics team’s control. The engineer writes transforms that create warehouses and marts, and implements tests that monitor data at every point along the pipeline, so others can do analytics without being operations experts.
What does a DataOps dashboard show?
It gives a high-level overview of the end-to-end data pipeline: whether any data is failing quality tests, what the error rates are, and which data sources are troublesome. With that information at hand, the data engineer can proactively improve pipeline robustness, and a high-severity anomaly triggers an alert so production analytics get protected first.
Why does bad data damage the analytics team more than the report?
When errors reach published analytics, the fix becomes unplanned work that diverts key contributors from the highest-priority projects. Worse, bad data harms the hard-won credibility of the data-analytics team. If business colleagues repeatedly see bad data in reports, they may learn not to trust or value the team’s work product at all.
Should you build a DataOps Platform or buy one?
You can create your own DataOps Platform from scratch, although partnering with a supplier reduces time to market. Working with a partner also lets you treat the entire CDP and data pipeline as a managed service, initially outsourced and then partly or entirely taken over by internal resources later. Once set up, a DataOps Platform transitions to an internal team seamlessly.
Get the PDF
The full paper is on this page. Fill in the form for a PDF copy to keep or share.