The Production-Only View of Data Architecture
We’ve been attending data conferences for over 20 years. It has been common to see presenters display a data architecture diagram like the (simplified) one below (figure 1). A data architecture diagram shows how raw data turns into insights. As the Eckerson Group writes, “a data architecture defines the processes to capture, transform, and deliver usable data to business users.”
In our canonical data architecture diagram, data sources flow in from the left and pass through transformations to generate reports and analytics for users or customers on the right. In the middle, live all of the tools of the trade: raw data, refined data, data lakes/warehouses/marts, data engineering, data science, models, visualization, governance and more. Tools and platforms can exist in the cloud or on premises. Most large enterprise data architectures have evolved to use a mix of both.
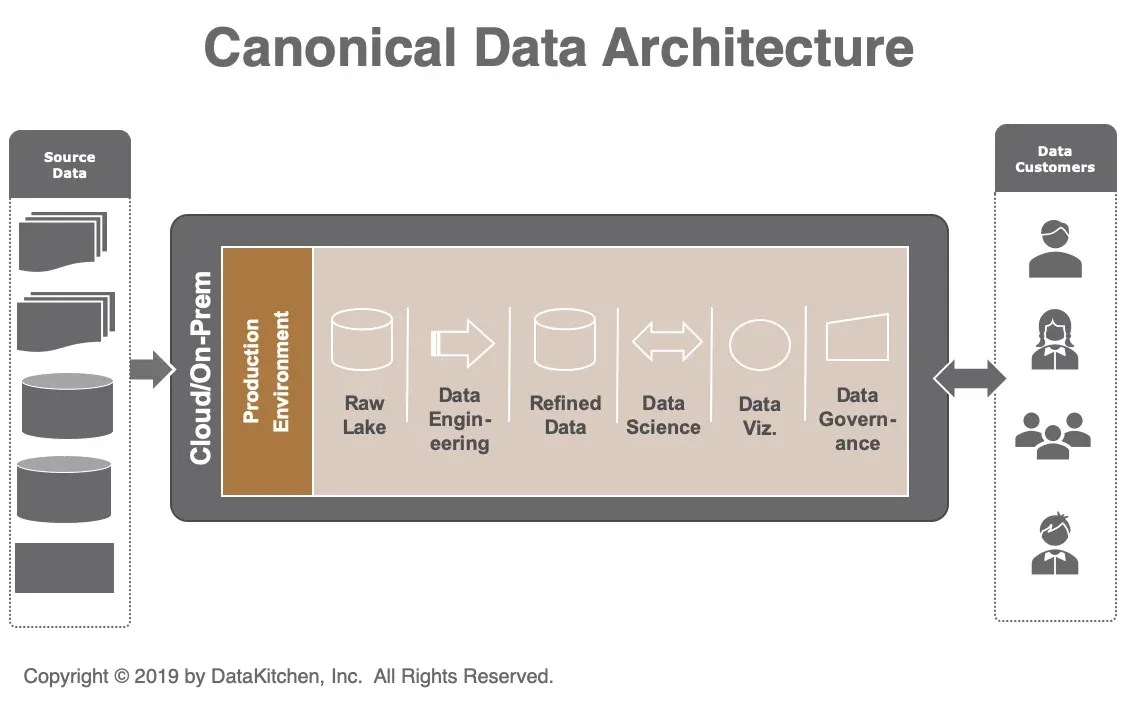
When data professionals define data architectures, the focus is usually on production requirements: performance, latency, load, etc. Engineers and data professionals do a great job executing on these requirements. The problem is that the specifications don’t include architecting for rapid change.
They only think about production, not the process to make changes to production. A DataOps Data Architecture makes the steps to change what is in production a “central idea.” Thinking first about changes over time to your code, your servers, your tools, and monitoring for errors are first class citizens in the design.
Architecting for Change
Take this example. Mobile phone designs increasingly locate batteries in fixed locations underneath sensitive electronics. In many cases, batteries can no longer be easily accessed and replaced by a consumer. The “Right to Repair” movement advocates for policies that enable customers to fix the things that they own instead of throwing them away.
When managers and architects fail to think about architecting the production data pipeline for rapid change and efficient development, it is a little like designing a mobile phone with a fixed battery. You can end up with processes characterized by unplanned work, manual deployment, errors, and bureaucracy. It can take months to deploy a minor 20 line SQL change.
Building a data architecture without planning for change is much worse than building a mobile phone with a fixed battery. While mobile phone batteries are swapped every few years, your analytics users are going to want changes every day or sometimes every hour. That may be impossible with your existing data architecture, but you can meet this requirement if you architect for it. If data architectures are designed with these goals in mind, they can be more flexible, responsive, and robust. Legacy data pipelines can be upgraded to achieve these aims by enhancing the architecture with modern tools and processes.
A DataOps Data Architecture
Imagine if your data architects were given these requirements up front. In addition to the standard items, the user story or functional specification could include requirements like these:
- Update & publish changes to analytics within an hour without disrupting operations
- Discover data errors before they reach published analytics
- Create and publish schema changes in a day
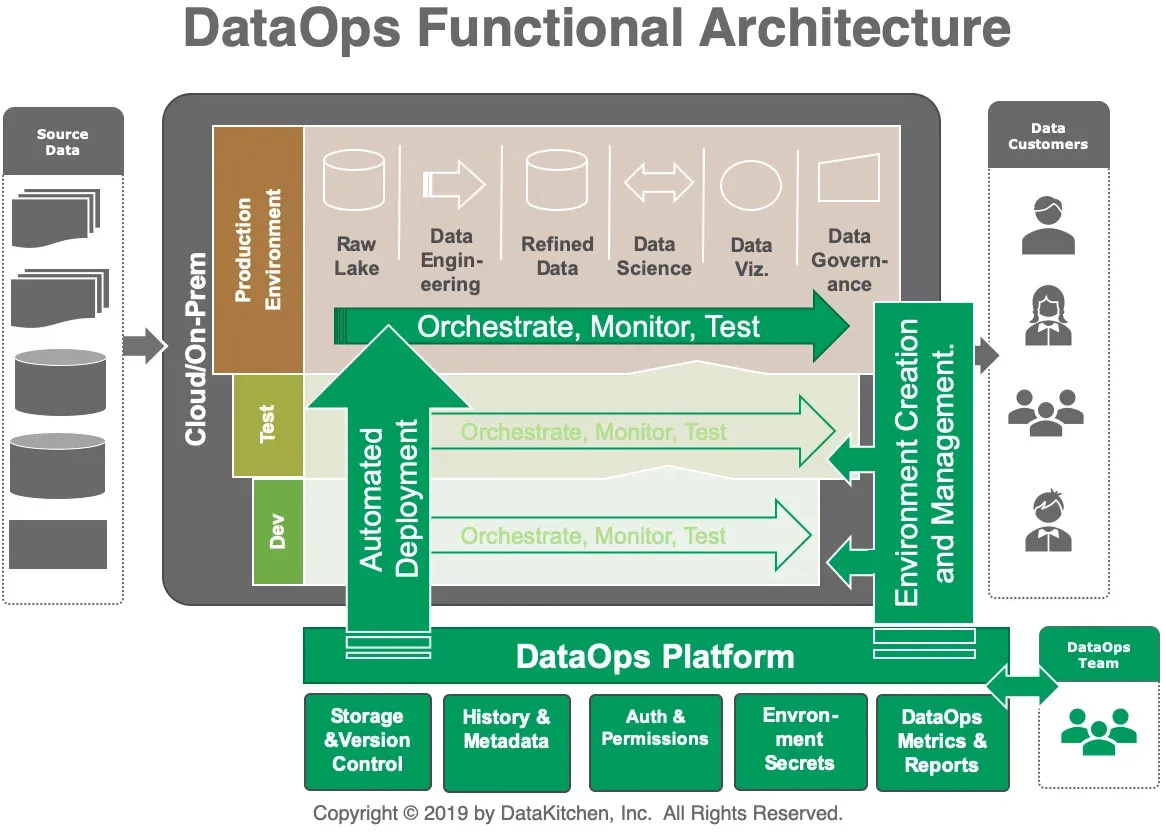
If you are a data architect yourself (or perhaps you play one), you may already have creative ideas about how you might address these types of requirements. You would have to maintain separate but identical development, test, and production environments. You would have to orchestrate and automate test, monitoring, and deployment of new analytics to production. When you architect for flexibility, quality, rapid deployment, and real-time monitoring of data (in addition to your production requirements), you are moving towards a DataOps data architecture as shown in figure 2.
The DataOps data architecture expands the traditional operations-oriented data architecture by including support for Agile iterative development, DevOps, and statistical process control. We call these tools and processes collectively a DataOps Platform. The DataOps elements in our new data architecture in figure 2 are shown in shades of green.
Breakdown of the DataOps Architecture
A DataOps architecture contains support for environment creation and management. This enables separate development, test, and production environments, which in turn support orchestration, monitoring, and test automation. The software automates impact review and new-analytics deployment so that changes can be vetted and published continuously. Agents in each environment operate on behalf of the DataOps Platform to manage code and configuration, execute tasks, and return test results, logs, and runtime information. This enables the architecture to work across heterogeneous tools and systems. The DataOps Platform also integrates several other functions which support the goal of rapid deployment and high quality with governance:
| Function | What it does | Examples |
|---|---|---|
| Storage / Revision Control | Version control manages changes in artifacts; essential for governance and iterative development. | git, docker hub |
| History and Metadata | Manage system and activity logs. | MongoDB |
| Authorization and Permissions | Control access to environments. | Auth0 |
| Environment Secrets | Role-based access to tools and resources within environments. | Vault |
| DataOps Metrics and Reports | Internal analytics provide a big-picture assessment of the state of the analytics and data team. We call this the CDO Dashboard. | Tableau |
| Automated Deployment | Moving the code/configuration from one environment (e.g., a test environment) to a production environment. | Jenkins, CircleCI |
| Environment Creation and Management | Treat your infrastructure as code; be able to create places for your team to do work with all the required hardware, software, and test data sets they need. | chef, puppet |
| Orchestrate, Test, Monitor | As your pipelines are running, orchestrate all the tools involved, test and monitor, and alert if something goes wrong. | Airflow, Great Expectations, Grafana |
Multi-Location DataOps Data Architecture
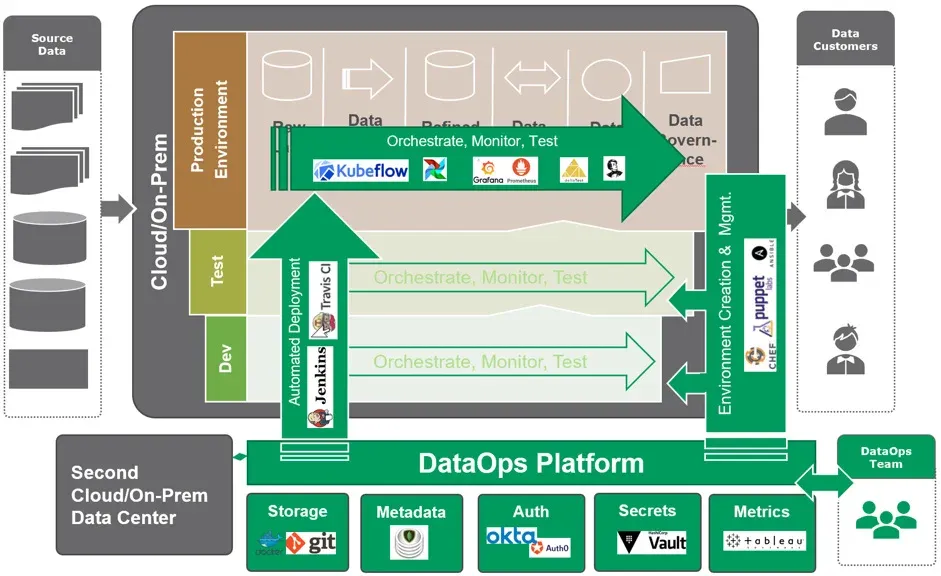
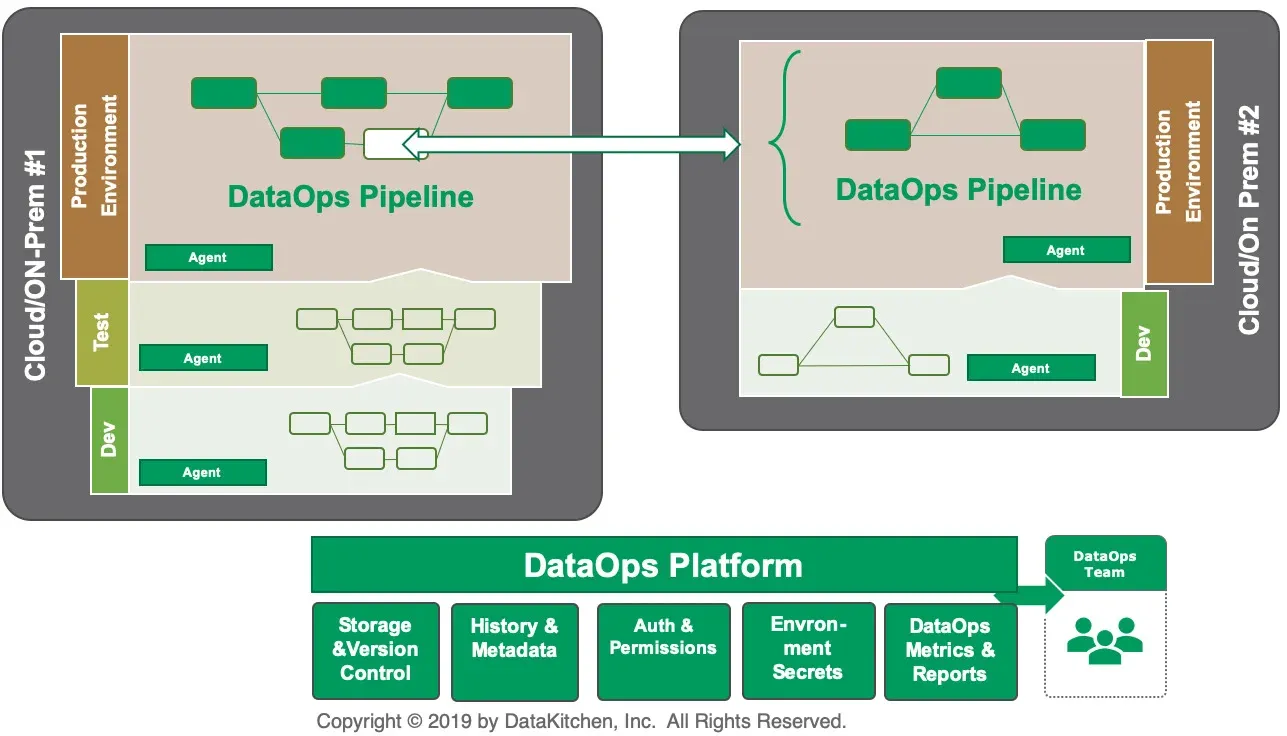
Companies are increasingly moving their work from on-premises to the cloud. Enterprises are choosing to have multiple cloud providers, as well. As a result, your data analytics workloads can span multiple physical locations and multiple teams. Your customers only see the result of that coordination. How can you do DataOps across those locations and teams and not end up with a “Data Ooooops”? Think of a “hub and spoke” model for your DataOps Data Architecture.
As shown in figure 4, the DataOps Platform is the hub for your distributed sites engaging in development and operations. Testing is also coordinated between the sites.
Building DataOps Into an Existing Data Architecture
Whether your current data architecture is on-prem or in the cloud or a mix of both; whether you have a standard environment or live in a multi-tool world, you can evolve your system to incorporate DataOps functionalities. You can build a DataOps Platform yourself or leverage solutions from the vibrant and growing DataOps ecosystem. DataOps can help you architect your data operations pipeline to support rapid development and deployment of new analytics, robust quality, and high levels of staff productivity.
You have the “Right to Repair” your data architecture — design for it!
Install Open Source DataOps TestGen — free, runs on a laptop, and profiles your first table in under an hour. It is the smallest useful piece of the architecture in this paper.
Related Reading
- DataOps Data Architecture — the blog version of this paper
- What is DataOps? — the discipline this architecture implements
- Environments Power DataOps Innovation — why separate, identical environments are the load-bearing requirement
- DataOps Is Not Just a DAG for Data — orchestration is necessary and nowhere near sufficient
- Add DataOps Tests for Error-Free Analytics — the tests that make a repair verifiable
- How DataOps Kitchens Enable Version Control — revision control as an architectural component
- 7 Steps to Implement DataOps — the practices that fill in this architecture
- DataOps Observability: Taming Chaos — how you find out something broke in the first place
FAQ
What is the main point of this paper?
Data architectures are specified for production and never for change, which is why a twenty-line SQL change can take months to ship. A ‘right to repair’ data architecture treats the process of changing production as a central design idea: separate development, test, and production environments, orchestration, automated testing and monitoring, and automated deployment are architectural components, not afterthoughts.
What is a DataOps data architecture?
A DataOps data architecture expands the traditional operations-oriented architecture by adding support for Agile iterative development, DevOps, and statistical process control — collectively a DataOps Platform. Alongside sources, lakes, engineering, and visualization, it includes environment creation and management, orchestration, monitoring, test automation, automated deployment, and version control as first-class components.
What does ‘right to repair’ mean for a data architecture?
The Right to Repair movement advocates for policies that let customers fix the things they own instead of throwing them away. Applied to data, it means the architecture is built so the team responsible for a pipeline can change and fix it quickly. Failing to design for that is like designing a phone with a battery nobody can replace.
Why don’t standard data architecture diagrams help?
Because they show where data sits and how it moves in production, not the process for changing production. The canonical diagram — sources flowing in from the left, raw and refined data, lakes and warehouses, engineering, science, models, visualization and governance in the middle, customers on the right — is accurate and silent about deployment, testing, environments, and error detection.
What requirements should a data architect be given up front?
Three, in addition to the standard production items: update and publish changes to analytics within an hour without disrupting operations; discover data errors before they reach published analytics; and create and publish schema changes in a day. Those three force separate environments, automated testing, monitoring, and automated deployment into the design rather than leaving them to heroics.
What functions does a DataOps Platform add to the architecture?
Eight. Storage and revision control for artifacts; history and metadata for system and activity logs; authorization and permissions for environment access; environment secrets for role-based access to tools; DataOps metrics and reports for a big-picture view of the team; automated deployment between environments; environment creation and management as code; and orchestrate, test, and monitor across running pipelines.
What do agents do in a DataOps architecture?
Agents run in each environment and operate on behalf of the DataOps Platform. They manage code and configuration, execute tasks, and return test results, logs, and runtime information to the platform. Because the work happens locally and only results travel, the architecture works across heterogeneous tools and systems rather than requiring one vendor’s stack everywhere.
Why do you need separate development, test, and production environments?
Because publishing a change within an hour without disrupting operations requires somewhere safe to build and verify it first. Separate but identical development, test, and production environments let a change be created, tested against real data, and reviewed before deployment. Treat environment creation as infrastructure as code so a new workspace comes with the hardware, software, and test data it needs.
Can a DataOps architecture span multiple clouds and on-premises systems?
Yes, and workloads spanning multiple physical locations and multiple teams is now the common case as companies adopt several cloud providers alongside on-premises systems. Use a hub-and-spoke model: the DataOps Platform is the hub for distributed sites doing development and operations, and testing is coordinated between the sites so one team can see whether everything worked.
What is the CDO Dashboard?
The CDO Dashboard is internal analytics about the data team itself — a big-picture assessment of the state of the analytics and data organization, built from the metrics the DataOps Platform already collects while running pipelines. It is one of the functions integrated into the platform, alongside version control, metadata, permissions, secrets, and automated deployment.
How do you add DataOps to a data architecture you already have?
Incrementally. Whether the current architecture is on-premises, in the cloud, or a mix, and whether it is standardized or a multi-tool world, it can evolve to incorporate DataOps functionality. Build a DataOps Platform yourself or adopt solutions from the DataOps ecosystem, then use it to support rapid deployment of new analytics, robust quality, and higher staff productivity.
Get the PDF
The full paper is on this page. Fill in the form for a PDF copy to keep or share.