Framing the Build Versus Buy Decision
When a data organization decides to implement DataOps, it can take one of two approaches. The team can develop DataOps in-house, or it can buy DataOps from a third party — it’s a classic “build versus buy” decision. When we talk about DataOps, we mean creating data lifecycle workflows backed by technology and automation that enable lightning-fast development and deployment with virtually zero errors, seamless collaboration, observability, and process transparency. Some people write a few unit tests and proudly call it “DataOps.” Unit tests are a move in the right direction, but transforming a typical data-analytics organization (and ultimately an enterprise) to market-leading levels of agility requires foundational change and continuous improvement.
Do-it-yourself builders of DataOps start with DevOps, workflow or other lifecycle tools and customize them to integrate with their existing toolchains. Custom software and application development must address the significant gaps between generic tools and DataOps requirements. Below we’ll enumerate these gaps to provide a better understanding of a fully automated DataOps lifecycle.
Those who buy DataOps turn to an off-the-shelf ‘plug and go’ platform easily adapted to their workflows and technical environment. With many vendors making claims of singlehandedly delivering DataOps, the “buy DataOps” approach has unfortunately been clouded by misunderstandings.
DataOps is among the hottest topics in the rapidly growing data-analytics tools market. Perhaps it’s not a surprise that tool vendors exaggerate their DataOps capabilities. It’s important to distinguish between tools that focus on one aspect of the analytics system and tools that take a broad lifecycle view. For example, consider a tool that automates specific processes related to streaming data or data lakes. Such a tool can be advantageous and a positive step for a data team, but its scope is limited to a specific set of tasks. In terms of DataOps maturity, it perhaps moves one maturity criteria a notch in the right direction. In order to attain the broad benefits of DataOps, the methodology must infuse the end-to-end data lifecycle from development to deployment to production to observability. When we consider the build versus buy decision for DataOps, we differentiate between a special-purpose tool with DataOps benefits and a “DataOps Superstructure” that encompasses and integrates all data workflows and tools in the end-to-end development and operations pipelines. A DataOps Superstructure, or a DataOps Platform, simplifies integration by connecting with your toolchains out of the box. It also includes the broadest range of data lifecycle support required for DataOps. A special-purpose tool is designed for a specific purpose. A DataOps Platform, such as from DataKitchen, must be flexible enough to work with new and innovative DataOps capabilities that will undoubtedly emerge in the future.
We frame the build versus buy decision for DataOps in terms of acquiring a DataOps Superstructure off-the-shelf or, alternatively, designing a DataOps Superstructure based on an assembly of best-in-breed generic and special-purpose tools. The decision ultimately rests on a team’s level of technical expertise, the complexity of the data analytics organization, and the enterprise’s goals. We’ll outline some key considerations that should factor prominently into your build versus buy decision. In doing so, we make a case for an off-the-shelf DataOps Superstructure, but if you prefer to build DataOps on your own, our discussion will most certainly inform your efforts.
Adding DataOps to a Data Organization
A typical data-analytics system includes a wide array of tools: an analytic database, blob storage, data streaming, ETL/ELT, BI, and data governance tools. Figure 1 shows examples of these tools within cloud, enterprise, on-prem or open-source ecosystems. A discussion on this topic would not be complete without mentioning other tools like dbt, Pentaho, Data Bricks, and self-service tools like Alteryx.
| AWS | Azure | GCP | IBM Cp4d | On Prem | Open Source | |
|---|---|---|---|---|---|---|
| analytic database | Redshift | Synapse | Big Query | DB/2 | Teradata | Spark |
| blob store | S3 | ADLS Gen2 | GCS | IBM Cloud Object Storage | sFTP | sFTP |
| streaming tool | Kinesis | Event Hub | cloud Pub/Sub | IBM Event Streams | Kafka | Kafka |
| ETL/ELT Tool | Glue | Data Factory | Composer | Data Stage | Informatica | Airflow |
| data science tool | Sagemaker | Databricks | Cloud ML | Watson Studio | SAS | Jupyter |
| BI Tool | Quicksight | PowerBi | Looker | Cognos | Tableau | Superset |
| data gov tool | Glue Data Catalog | Azure Data Catalog | Cloud Data Catalog | Watson Knowledge Catalog | Alation | Apache Atlas |
There are also different types of supporting tools that data analytics requires (figure 2): Git and its variants for version control, a secret store for managing digital authentication credentials, Kubernetes for managing queries across clusters, and single sign-on authentication.
| AWS | Azure | GCP | IBM Cp4d | On Prem | Open Source | |
|---|---|---|---|---|---|---|
| git provider | CodeCommit | Azure Repos | Cloud Source Repos | github | github | gitlab |
| secret store | Secrets Manager | Azure Key Vault | Secret Manager | IBM Security Secret Server | Vault | Vault |
| k8s cluster | EKS | AZS | GKE | OpenShift | Vanilla k8s | Vanilla k8s |
| SSO provider | AWS SSO | Azure Active Directory | Cloud Identity | IBM Cloud IAM | Okta | DK Default |
In summary, to build DataOps, one has to pick a stack, assemble the toolchain from within that ecosystem, and provision an array of supporting tools — a giant system integration project (figure 3). This undertaking is fine for teams with extensive software development skills that perform integration as a value add, but for everyone else, it’s a huge barrier to entry.
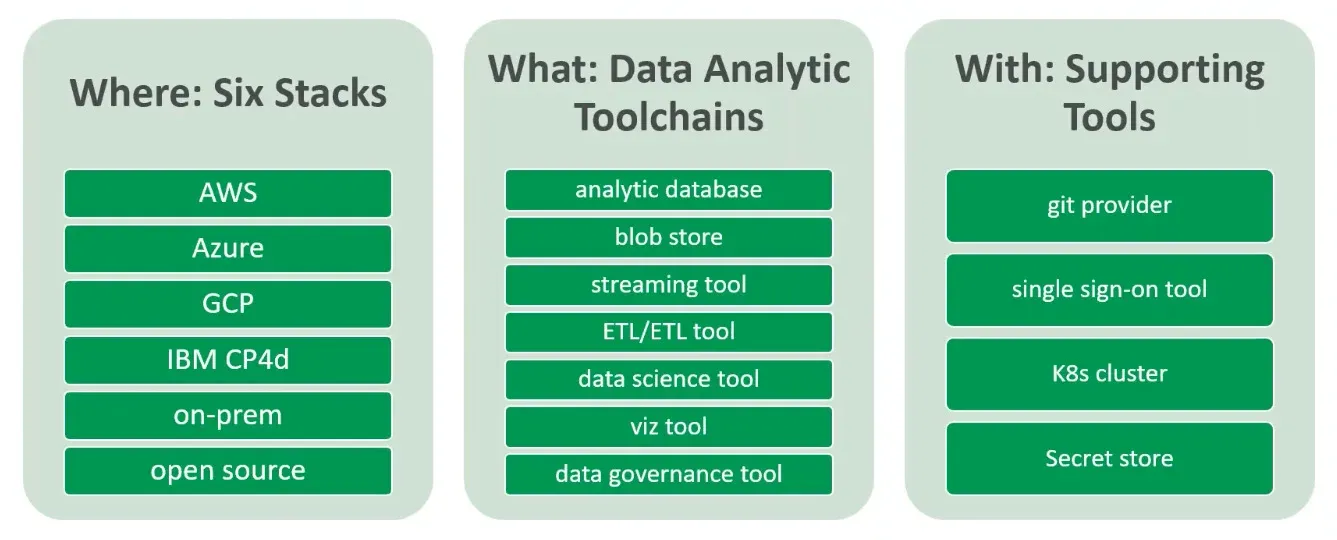
There is no unifying system that helps all of these various tools work together. For example, someone writing tests at various stages of the data analytics pipeline must become adept at each of the tools along the toolchain.
Additionally, large organizations typically support more than one stack. One group may use AWS. A second group uses a different cloud vendor or an on-prem toolchain. If these diverse toolchains combine into a single analytics deliverable, then complexity is further multiplied. It can be a bit overwhelming for do-it-yourselfers to design a system that follows DataOps principles in the context of such wide diversity.
A DataOps Superstructure, or a DataOps Platform, that encompasses all of the data organization’s stacks and toolchains makes it much easier to augment a toolchain with DataOps methods. A DataOps Platform connects with each of the tools within the stacks and provides a common domain for orchestration, testing, monitoring, management, and other DataOps functions. For example, you can write tests that monitor real-time data operations within the common domain of the DataOps Superstructure. You can learn one tool and test inputs, outputs, and business logic at any step in the data pipeline.
The DataKitchen Platform is an example of a DataOps Platform. It complements your existing tools and unifies your end-to-end toolchains. It operates as the control center for your DataOps program and enables your team to implement DataOps without learning multiple new technologies or programming languages. Instead, team members can continue to use the tools they know and love. Once their preferred technologies connect to the DataOps Platform, it guides the users and teams to develop, deploy, and enhance complex data analytic systems according to DataOps methods.
NOTE
The product this paper calls the DataKitchen Platform is now DataOps Automation. Kitchens, Recipes and Ingredients are still exactly how it works, so everything below still applies; only the product name has changed.
Critical Capabilities for Successful DataOps
When speaking of a DataOps Superstructure, like the DataKitchen Platform, it’s worth exploring how this contrasts with an approach that seeks to implement DataOps from scratch using DevOps and workflow tools. Software developers or IT engineers may not appreciate some unique characteristics of data analytics systems that are difficult to address with standard DevOps or workflow tools. Fundamentally, any DataOps solution requires the following capabilities:
- Meta-Orchestration
- Continuous Data Lifecycle
- Environment Pipeline
- Complex Team and Data Center Coordination
- Common System and Vocabulary
- Process Measurement
- Integrated Testing and Monitoring Domain
When all of these capabilities are enabled, organizations can deliver analytics and data science models with drastically less cycle time and greater quality. We cover each of the key capabilities in greater detail below so you can determine if your team has the capabilities to build and maintain a complete DataOps Platform.
Meta-Orchestration
DataKitchen often likens analytics to a factory assembly line process. As data moves through the system, it gets processed, transformed and assembled into charts, graphs, and other analytics. Do-it-yourselfers may attempt to orchestrate a data analytics pipeline with DevOps tools like Control-M or perhaps a workflow tool. DevOps and workflow tools lack an intelligent, test-informed, system-wide production orchestration capability — a set of concepts we group under the term Meta-Orchestration. DataOps Meta-Orchestration requires connectors to data science tools, the ability to execute DAGs of DAGs, and observable orchestration. Each of these concepts is further explained below.
Connectors
DataOps requires integration with an ecosystem of data analytics tools. DevOps tools are generally aimed at the software development ecosystem. If you apply DevOps tools to data science, you take on the in-house development and maintenance of connectors to an array of data engineering, data science, data analytics, self-service, governance, and database tools. With an off-the-shelf DataOps Platform like DataKitchen, connector support for the data analytics ecosystem is a bundled feature.
DAGs of DAGs
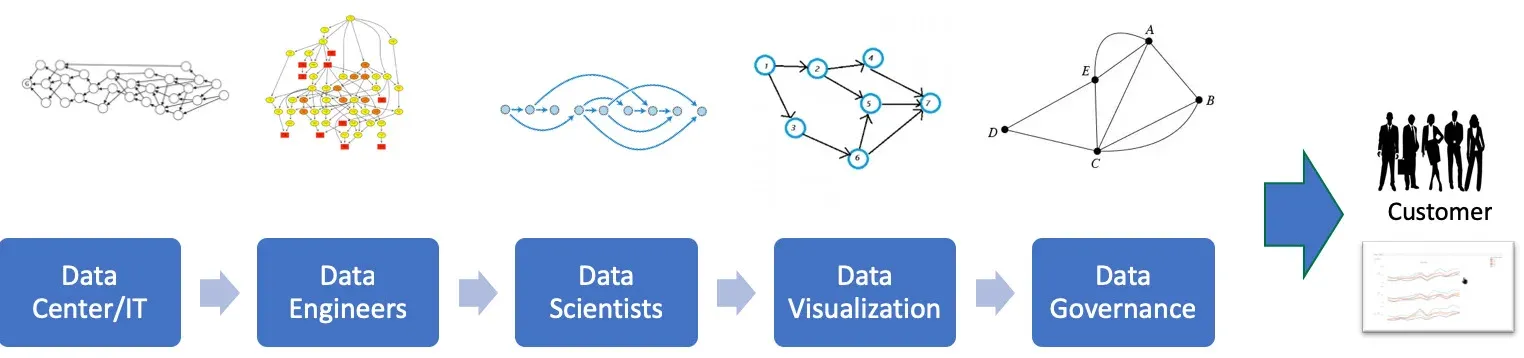
Think of your analytics development and data operations workflows as a series of steps that can be represented by a set of directed acyclic graphs (DAGs). Each node in the DAG represents a step in your process. The data production pipeline is actually a hierarchy of pipelines or a DAG of DAGs. For example, data center, data engineering, data science, visualization, and governance steps of data operations all consist of sub-pipelines. The sub-pipelines can be further subdivided into sub-sub-pipelines. When you factor in data centers, groups, toolchains, and self-service users, a data pipeline is more accurately described as DAGs of DAGs (figure 4). DevOps orchestration tools don’t natively cover all of these heterogeneous use cases. A DataOps Platform orchestration capability is specifically designed to handle the complexity inherent in data analytics pipelines that span numerous toolchains. This feature facilitates inter-team collaboration, so we’ll be further exploring it below.
Observable Orchestration
DataOps requires the orchestration of production pipelines that integrates with testing, monitoring, and real-time alerts. The powerful combination of orchestration and observability is a major tenet of DataOps — we’ll call it “observable orchestration.” As large quantities of data flow through the data factory, tests at each stage of the pipeline ensure that input, outputs, and business logic are valid. Tests provide an unparalleled level of transparency into data operations. Operations are monitored to be certain that quality is maintained. For example, if a model’s performance degrades, the system can be configured to detect that situation and take action. Conditional events can be configured to issue real-time alerts to the data team and/or stop data pipeline processing to prevent errors from corrupting analytics. DevOps orchestration tools do not natively support observability.
Using a DataOps Platform for Meta-Orchestration
A DataOps Superstructure, like the DataKitchen Platform, is designed specifically for DataOps challenges. It supports connectors to the broad array of tools in the data analytics and data science ecosystem. It orchestrates DAGs of DAGs coherently, so your various toolchains and self-service users work together seamlessly. DAGs can incorporate existing toolchain orchestrations so you can build DataOps upon your existing architecture. The DataKitchen Platform integrates testing, alerts and monitoring into orchestration, ensuring high levels of quality and providing unparalleled transparency into data operations.
Continuous DataOps Lifecycle
One common misconception about DataOps is that it is just DevOps applied to data analytics. The realities of orchestrating the development and data operations pipelines in data analytics are much more complex and challenging than the ‘build-test-deploy’ paradigm of the software development world.
DevOps focuses on two foundational concepts: Continuous Integration (CI), which automates the building and integration of new code, including regression testing, and Continuous Deployment (CD), automated deployment of code to production environments. Figure 5 shows the orchestration of CI and CD in a typical software development pipeline.
DataOps has to manage a significantly more complex development and deployment lifecycle. Data analytics has both a code development pipeline and a dynamic production data operations pipeline. The existence of the data factory adds an additional level of complexity to the analytics development lifecycle.
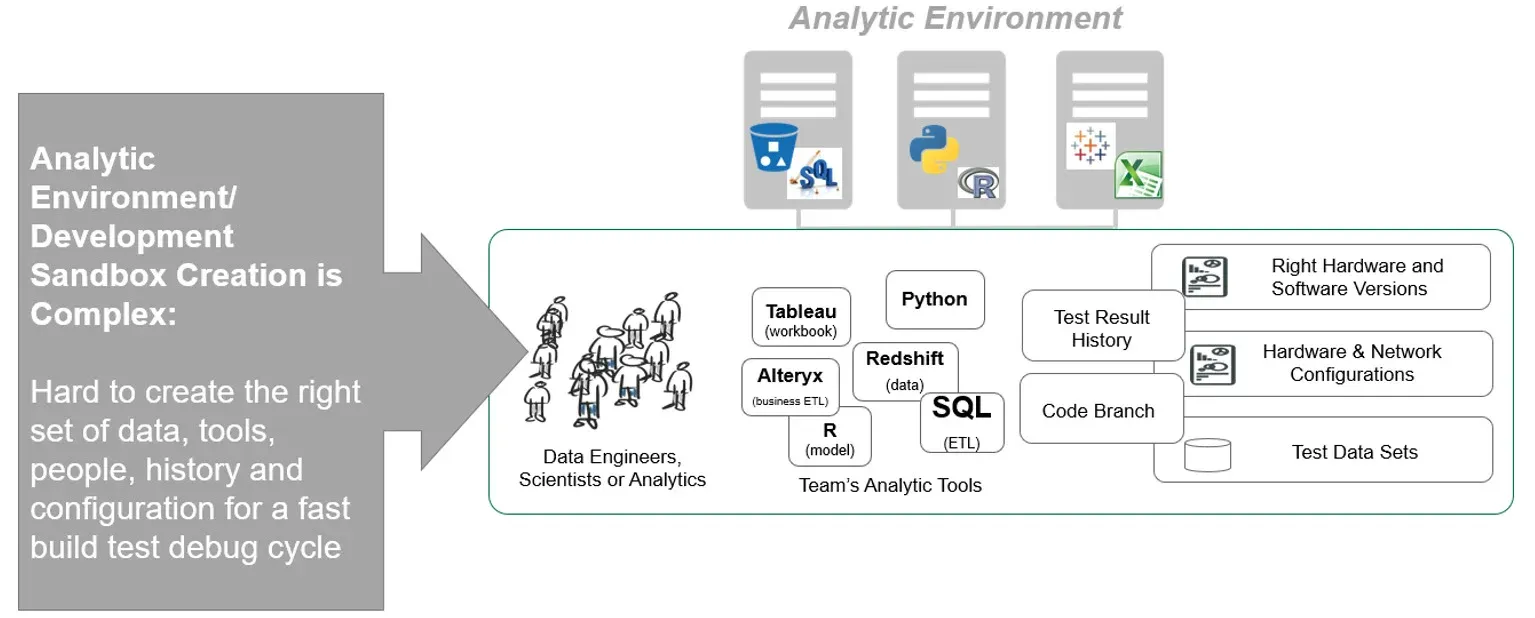
In data analytics, sandbox management, or the creation of an analytics development environment, requires multiple meta-orchestrated toolchains, fully functional data pipelines, and governance of sensitive data. Development environment creation in DataOps is considerably more complex than in DevOps, which focuses on stack instantiation and often utilizes static test data.
Continuous integration in DataOps requires the orchestration of the DAGs of DAGs that comprise the data-analytics pipelines. CI in DataOps includes the multitude of stacks, databases (test data), and orchestrations that span an organization’s end-to-end data lifecycle.
Deployment to production in DataOps resembles DevOps, except that production has the additional task of testing and monitoring data, which flows endlessly through the system and changes over time.
We expand the CI/CD concept popularized in DevOps to its DataOps equivalents. DataOps includes:
- Continuous Self-Service Sandboxes (Sandbox Management)
- Continuous Meta-Orchestration
- Continuous Integration
- Continuous Deployment
- Continuous Testing
- Continuous Monitoring
Note the two orchestrations in Figure 5. The first orchestration in the figure applies to the copy of the data pipelines inside the sandbox development environment. The second orchestration applies to the data operations pipelines in production.
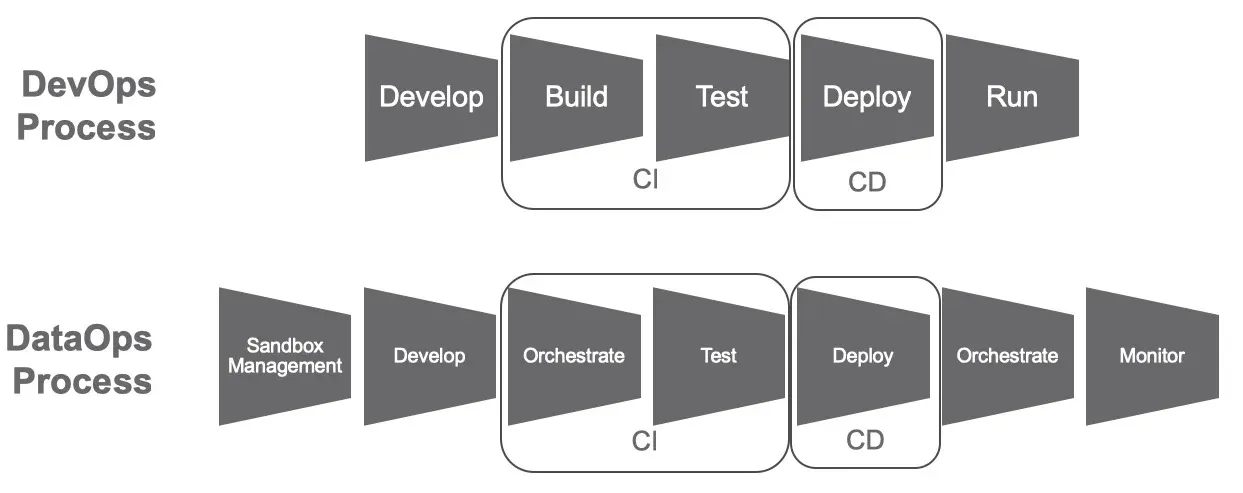
The components of the DataOps lifecycle don’t easily lend themselves to a snappy acronym like CI/CD. DataOps automates all of the various aspects of the data lifecycle so that they occur rapidly, efficiently, repeatedly, and robustly. We’ll call this the “Continuous DataOps Lifecycle,” and we mean it to include every aspect of the end-to-end data lifecycle that can be automated. For example, despite being absent from our flow chart, we see data governance as a critical component of DataOps, so we have written and produced webinars about DataGovOps, Continuous Governance, and Governance-as-Code. We also include DataSecOps, a methodology that automates data privacy and security, integrating them into automated workflows that execute alongside data-analytics development, deployment, and operations. Every part of the data lifecycle that can execute continuously under automated orchestration can be part of the Continuous DataOps Lifecycle.
The Continuous DataOps Lifecycle provides a compelling case for the need for a DataOps Superstructure. DevOps tools like Jenkins or Azure Pipeline can help with the CI/CD portion of the problem, but the rest would require a great deal of customization and maintenance. A DataOps Platform ensures that environments, meta-orchestration, testing, deployment, monitoring, and governance all operate together as one coherent system. This coordination enables new analytics to seamlessly migrate to production and run successfully without errors or side effects.
Environment Pipelines
The provisioning of environments is significantly more challenging in data analytics than in software development due to the complexity of orchestrating two pipelines: analytics development and production. A data analytics environment, called a Kitchen, includes meta-orchestrations, toolchain stacks for each sub-orchestration, access control, code and configuration files for each tool, version control, test data, a fully functioning production pipeline, and testing and monitoring. DevOps infrastructure tools like Puppet, Ansible, and Terraform don’t offer much turnkey help for most of these functions. With a collection of disparate tools, the user must be an expert in each tool and understand how and when they should be used together. Environment creation focused on development and deployment workflows are described below.
Self-Service Sandboxes
A software developer may be very comfortable creating scripts to instantiate their own development environment. A business analyst or business colleague using a self-service data analytics tool has limited ability to write scripts and little interest in engaging with infrastructure tools. Business users are focused on business goals, and for them, analytics are a means to an end.
The DataOps Platform supports a turnkey environment pipeline that allows self-service users to instantiate a complete development environment, with all of the required elements, on-demand (figure 6). We call this a self-service sandbox. Environment automation keeps freewheeling, self-service users confined within the framework of good development lifecycle practices. For example, you wouldn’t expect business users to reliably use version control (e.g., Git). A self-service sandbox handles that for them by generating a version control branch upon environment creation and merging changes as a part of environment deletion. The data team never loses control of the code and configuration files created in the course of decentralized analytics development.
Parallel Versions of Environments
The DataKitchen Platform’s environment pipeline makes it simple to instantiate many environments in parallel. These could be development sandboxes, as mentioned above, or prototype analytics shared with customers to quickly iterate on features and functions. The ability to figuratively copy and paste your entire analytic platform and then iterate on enhancements is one of the capabilities that dramatically improves analytics velocity. Users often don’t know what they want until they see what is possible. The ability to get a version of analytics out for feedback improves communication and collaboration between the data team and the users they serve.
Seamless Deployment
Parallel environments greatly ease the transition of analytics between co-workers or from a development sandbox to production. When the technical environments underlying two Kitchens match, analytics can move seamlessly between the two. When development and production Kitchens are aligned, data analysts can deploy analytics without the time consuming and risky effort of porting code to the production environment. With the DataKitchen Platform, analytics in Kitchen development environments effortlessly migrate to data operations via an agent that can remap analytics to a new toolchain instantiation.
Complex Team and Data Center Coordination
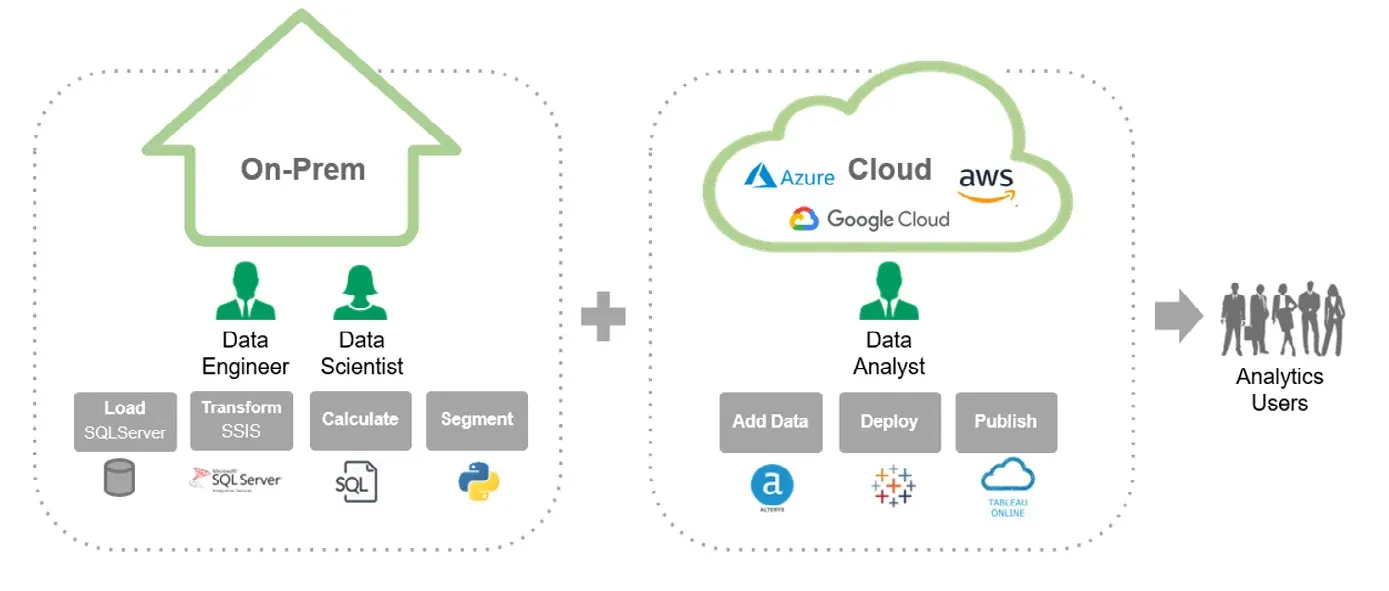
Data science, data engineering, and data analytics development often take place across multiple organizations, teams, and data centers. Many organizations straddle on-prem and cloud environments or are transitioning between the two (figure 7). When in transition, the data team ends up with a foot in both worlds, executing analytics on the source and target platforms at the same time. Some organizations remain cloud agnostic, so different groups choose different cloud providers. The result is managing many toolchains under one data enterprise with analytics spread across many different technical platforms. DataOps can serve as a unifying platform for organizations with a diverse mix of technical architectures. It can serve as the hub that enables all the platforms to work together. A system-level view and process to manage complexity are enormously difficult to achieve when building DataOps from scratch — and most teams building DataOps in-house don’t even try.
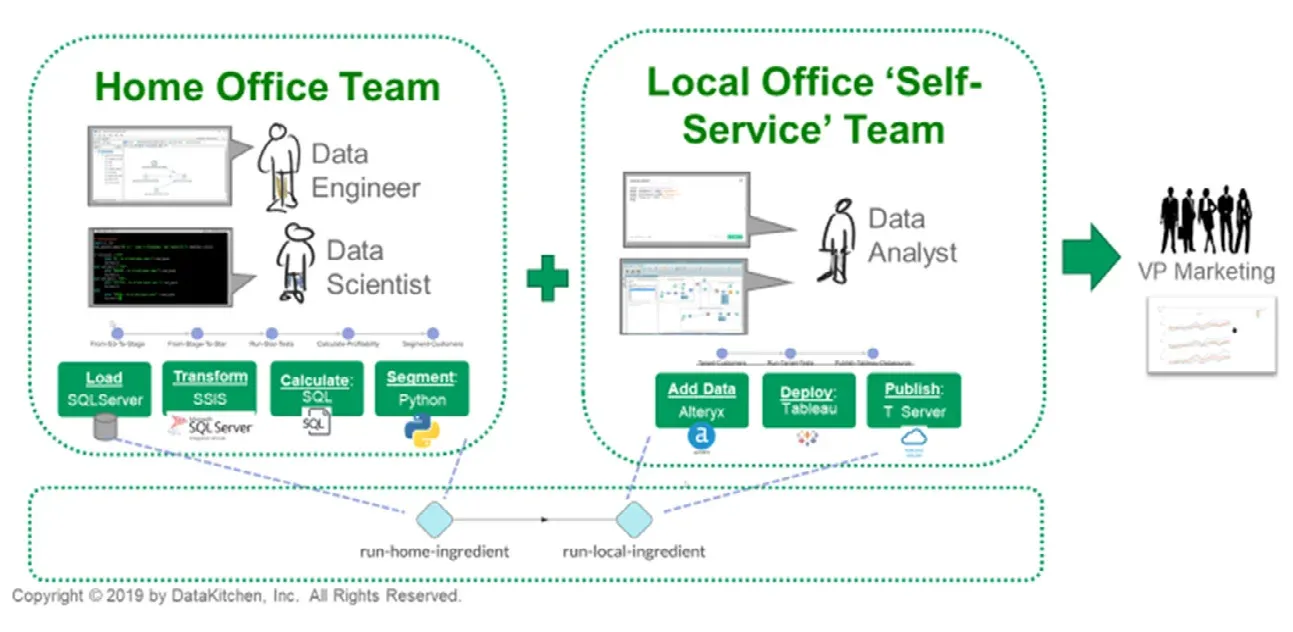
Many factors can interfere with teamwork. Figure 8 shows a home office team creating a data enablement platform and a local office with business users using self-service tools (Alteryx, Tableau, Looker, Trifacta, etc.) to create quick and innovative analytics. These two teams have to work together despite using different toolchains and operating at different iteration cadences. None of the cloud tools have the ability to orchestrate across teams. The collections of tools provided by the cloud vendors lack the team and environment awareness and management system necessary to facilitate the end-to-end data pipeline.
A DataOps Platform such as DataKitchen, on the other hand, enables local control with centralized management and visibility. The home office team encapsulates its local orchestration in the component “run-home-ingredient.” Similarly, the local office orchestrations sit underneath the component “run-local-ingredient.” A higher level pipeline executes run-home-ingredient and run-local-ingredient, producing integrated analytics for the VP of Marketing. The top-level pipeline brings the two teams together. DataOps tests make sure that neither side makes a change that breaks the other. With the DataOps Platform handling schema compatibility and the top-level pipeline integration, the teams can focus on their local work. DataOps structures collaboration so that it occurs seamlessly.
The classic struggle between centralization and freedom also plays out in the home office team’s inability to impose discipline or governance on the autonomous self-service activities in the local office. The DataKitchen Platform addresses this struggle with self-service sandboxes that provide the home office the ability to control and govern development environments, while self-service users freely innovate in safe and monitored sandboxes. The DataOps Superstructure helps preserve freedom for the self-service users while giving the home office the control and visibility they desire — everyone’s happy and productive.
Kitchens further promote collaboration by making it easy to create reusable components that can be shared with others or copied and edited. Analysts can run the different analytics components separately or together in a single process, with local control and centralized management and visibility.
Without the ability to share and reuse ideas, environments, and processes provided by a tool like DataKitchen, teams typically use inefficient manual methods to communicate and collaborate across teams, projects, and locations, significantly increasing cycle time and on-going management costs.
Common System and Vocabulary
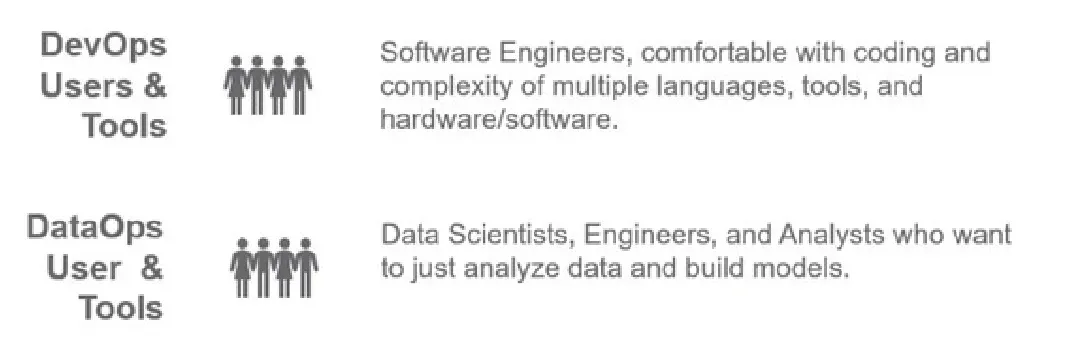
In general, software engineers embrace complexity and celebrate the latest and greatest tools. Your average software engineer enjoys unlocking the power of Git, DevOps, AWS/Azure/Google UI’s, workflow/DAG tools, testing frameworks, scripting languages, and infrastructure-as-code tools. Each new tool learned is a boost to the resume.
Conversely, data people prefer to focus on analyzing data and building models. Using tools is a means to an end. They prefer a more straightforward user experience that abstracts system complexity. While software engineers embrace toolchain complexity, data engineers and data scientists seek to avoid complexity. This difference is even more important when self-service analytics is a goal. Self-service analytics users, seeking simplicity and speed, rarely venture outside the safe and ordered confines of a single preferred tool.
The DataKitchen Platform provides a common platform that takes a system-level view across data engineering, data science, data governance, and other data-organization roles. The DataOps superstructure that unifies all of the various tools in the data pipeline helps simplify the analytics lifecycle for everyone. Building the system-level view and management process is so time-consuming that most organizations don’t even try. They may focus, for example, on the needs of data engineering and ignore everyone else.
The DataKitchen approach enables the machine to deal with as much tool complexity as possible. It takes the view that the toolchains should be intelligent and self-service. The DataKitchen Platform enables users to engage at their preferred level of complexity. While data engineers may look under the hood, self-service business users can focus on their business challenges, not the data toolchain. The DataKitchen Platform serves as a single view of reality for workflow processes. Managing levels of complexity is essential to business agility in a diverse workforce and can help foster DataOps principles.
Process Measurement
You can’t improve what you don’t measure, but most data analytics teams are surprisingly unanalytical about themselves. Process measurement is key for improving data workflows and operations. Although many analytics tools provide tool-specific data and logs, DataKitchen produces one combined data store with system-wide process metrics for the analytic system as a whole. This unified approach facilitates the collection, governance, and reporting of process lineage and other operational metrics, including data on collaboration, productivity, errors, and deployment time — all of which can be used to consistently improve quality and reduce delivery time.
Embracing DataOps requires data organizations to let go of misguided attachment to management based on hope and heroism. As DataOps drives your enterprise towards greater business agility, the data team has to confront its misconceptions. Veteran data scientists may believe that you cannot quickly make changes to a running system without causing problems. If something is working, better NOT to touch it. Putting DataOps into practice works against this outdated narrative.
DataOps strives to deploy quality analytics into production and continue iterating on it. The focus is on rapid improvements while testing extensively to ensure that analytics are error-free. One way to win converts to the DataOps approach is through demo projects. Data people also tend to be highly influenced by data. Win over skeptics by measuring processes and showing concrete results.
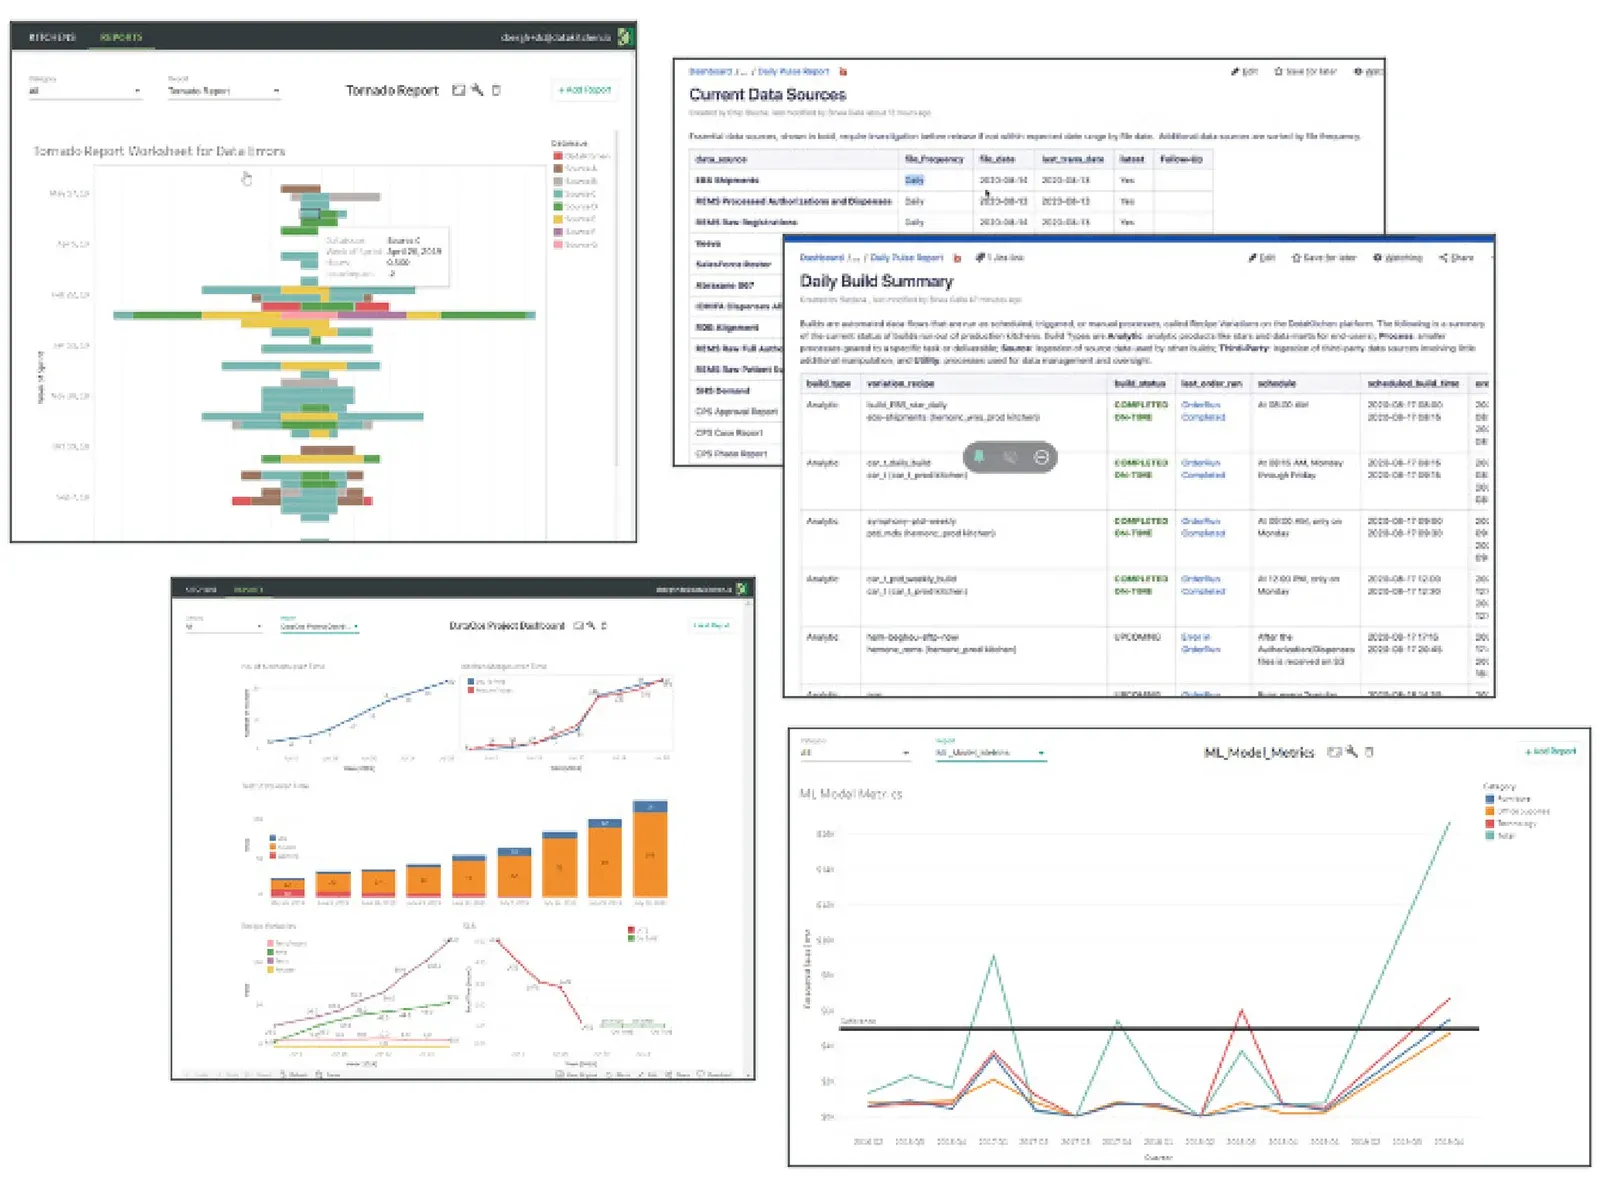
DataOps metrics and dashboards can help you show a reduction in errors while the number of tests rises (figure 9). With DataOps, the data team can receive alerts when model performance degrades to be insufficiently predictive. DataOps can verify that data is integrated, aggregated, and ready to feed into analytics. With DataOps automation, the data team can generate metrics on every aspect of the data lifecycle, and these metrics can help managers run their data teams more effectively. When people see, in a process measurement chart or dashboard, that DataOps is working, they will “buy-in.”
Without a system-wide process and performance data collection/reporting capability, data analytics and science teams will be left in the dark about the performance of their systems, teams, and processes, making on-going process improvements nearly impossible.
Integrated Testing and Monitoring Domain
Automated testing is foundational to successful DataOps. Integrating tests at every step of your production and development pipelines ensures that errors never reach the end-user. For success, each step in the entire analytic system should be tested and monitored, and orchestration must be informed by real-time test results, even stopping pipeline execution when necessary. A few unit tests in production do not achieve the goals of DataOps.
One approach seeks to stitch together the tool-specific logging capabilities provided by the respective tool vendors and to add custom business and data tests in each tool domain. In the complex multi-tool world of analytics and data science, this would require users to become experts in each of the various tools and languages that comprise the end-to-end data pipeline. At worst, system-wide testing ends up being done manually, or not at all, resulting in delays and poor quality.
Alternatively, the DataKitchen Platform offers an integrated test domain. Any team member can add tests, regardless of tool preference or technical ability. A standardized user interface allows users to create tests in their tool of choice or within the platform to span multiple enterprise tools. Real-time alerting is built into the system to increase agility and reduce downtime. Comprehensive end-to-end testing made possible by a DataOps Platform eliminates data errors and builds strong trust in the quality of the analytics.
Without an integrated test and alerting framework, like that provided by DataKitchen, one would have to integrate multiple quality, testing, reporting, and storage tools together to form a testing and reporting/monitoring system. Additionally, those test results would then somehow need to be integrated into a production processing system.
The Way Forward
When making a build versus buy decision, it is important to evaluate the technical complexity of your system. Assess whether the system you plan to deploy will outgrow your team’s expertise and capabilities. Consider the return on investment of your most valuable asset — your people — based on how you want them to be spending their time.
A DataOps Platform gives you the ‘SuperStructure’ required for successful DataOps. It provides a solid foundation for executing the key DataOps capabilities — meta-orchestration, a continuous data lifecycle, an environment pipeline, complex team and data center coordination, a common system and vocabulary, process measurement, and an integrated testing/monitoring domain — with minimal investment of time and energy. Our experience is that organizations that attempt to build their own DataOps system fail to meet their DataOps goals due to the complexity of system requirements. Also, they waste valuable staff resources. The reality for most teams is that the fastest and most cost-effective way to realize the benefits of DataOps is to adopt an off-the-shelf DataOps Platform like DataKitchen. DataKitchen connects a cacophony of tools into one cohesive system, removing that burden from the data team and enabling them to get back to doing what they do best — developing innovative analytics that deliver business value.
FAQ
What is the main point of this paper?
For most data teams, buying a DataOps Superstructure off the shelf is faster and cheaper than building one. Building means closing seven capability gaps yourself — meta-orchestration, a continuous data lifecycle, an environment pipeline, team and data center coordination, a common system and vocabulary, process measurement, and an integrated testing and monitoring domain — none of which generic DevOps or workflow tools provide.
What is a DataOps Superstructure?
A DataOps Superstructure, or DataOps Platform, is the layer that encompasses and integrates all data workflows and tools in the end-to-end development and operations pipelines. It simplifies integration by connecting with existing toolchains out of the box, and it provides one common domain for orchestration, testing, monitoring, and management rather than a separate one per tool.
How is a DataOps Superstructure different from a special-purpose tool?
A special-purpose tool is designed for a specific purpose, such as automating processes around streaming data or data lakes. It can move one DataOps maturity criterion a notch in the right direction. A Superstructure takes a broad lifecycle view across development, deployment, production, and observability, and stays flexible enough to work with DataOps capabilities that emerge later.
What does building DataOps in-house actually involve?
Picking a stack, assembling a data analytic toolchain from within that ecosystem, and provisioning an array of supporting tools — a giant system integration project. That is reasonable for teams with extensive software development skills who treat integration as a value add. For everyone else it is a huge barrier to entry, and there is no unifying system that makes the tools work together.
What is meta-orchestration?
Meta-orchestration is intelligent, test-informed, system-wide production orchestration. It requires three things DevOps and workflow tools lack: connectors to the data engineering, data science, self-service, governance, and database tools that make up a data ecosystem; the ability to execute DAGs of DAGs; and orchestration that integrates testing, monitoring, and real-time alerts.
What are DAGs of DAGs?
A data production pipeline is a hierarchy of pipelines rather than a single directed acyclic graph. Data center, data engineering, data science, visualization, and governance steps each consist of sub-pipelines, which subdivide further. Factor in data centers, groups, toolchains, and self-service users, and the pipeline is more accurately described as DAGs of DAGs.
Is DataOps just DevOps applied to data analytics?
No. Data analytics has both a code development pipeline and a dynamic production data operations pipeline, so the lifecycle is more complex than build-test-deploy. Sandbox creation requires multiple meta-orchestrated toolchains, working data pipelines, and governance of sensitive data, and production adds the task of testing and monitoring data that changes over time.
What is in the Continuous DataOps Lifecycle?
Continuous self-service sandboxes, continuous meta-orchestration, continuous integration, continuous deployment, continuous testing, and continuous monitoring. Data governance and data security belong there too, as DataGovOps and DataSecOps. Every part of the data lifecycle that can execute continuously under automated orchestration is part of the Continuous DataOps Lifecycle.
Why is provisioning environments harder in data analytics than in software?
Because two pipelines have to be orchestrated, analytics development and production. A data analytics environment includes meta-orchestrations, toolchain stacks for each sub-orchestration, access control, code and configuration files for each tool, version control, test data, a fully functioning production pipeline, and testing and monitoring. Puppet, Ansible, and Terraform offer little turnkey help for most of that.
What is a self-service sandbox?
A turnkey environment that a self-service user can instantiate on demand, with all the required elements already in place. Environment automation keeps those users inside good development lifecycle practices without asking them to run scripts: the sandbox generates a version control branch on creation and merges changes on deletion, so the data team never loses the code and configuration files created along the way.
How does a DataOps Platform coordinate teams that use different toolchains?
It encapsulates each team’s local orchestration as a component and runs a higher-level pipeline over those components. A home office team’s orchestration becomes run-home-ingredient, a local self-service team’s becomes run-local-ingredient, and the top-level pipeline executes both to produce one integrated deliverable. Tests make sure neither side ships a change that breaks the other.
Why does process measurement matter to a build versus buy decision?
You cannot improve what you do not measure, and most analytics teams are unanalytical about themselves. Tool-specific logs do not add up to a system view, so one combined data store of system-wide process metrics — collaboration, productivity, errors, deployment time — is what turns skeptics into converts and lets managers run data teams on evidence rather than intuition.
When does building DataOps in-house make sense?
When the team has extensive software development skills and treats system integration as a value add rather than overhead, and when the technical complexity of the system will not outgrow the team’s expertise. The test is the return on investment of the team’s time: assess whether you want your most valuable people building a platform or building analytics.
Get the PDF
The full paper is on this page. Fill in the form for a PDF copy to keep or share.