
Why DataOps?
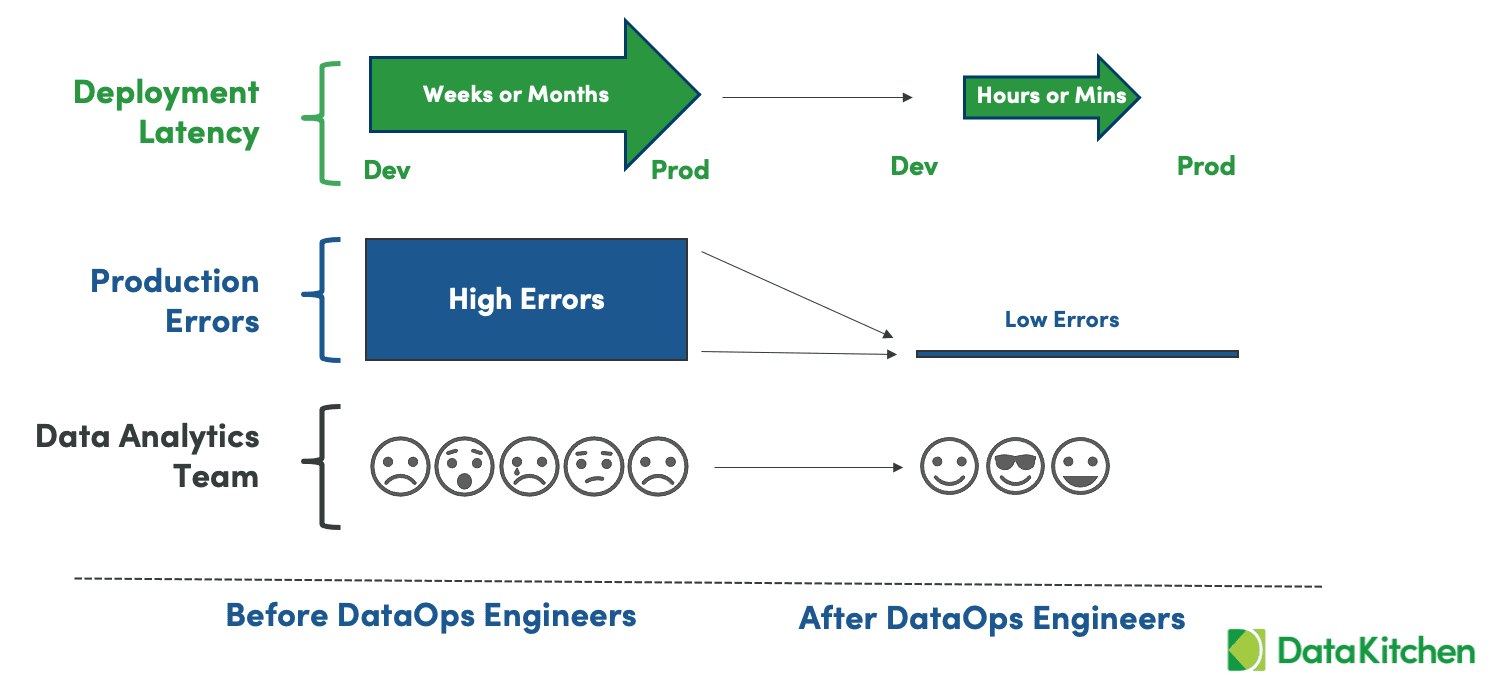
DataOps enables teams to reclaim control of their data pipelines, eliminate errors, and minimize the time from new ideas to the deployment of working analytics. The data teams that successfully adopt DataOps produce robust and accurate analytics more rapidly than their peers, powering strategic decision-making that gives them a competitive advantage. As such, DataOps is among the hottest topics in data and analytics.
DataOps Fundamentals
Because DataOps is so popular, perhaps it’s not a surprise that tool vendors exaggerate their DataOps capabilities. This causes significant confusion in the market. To assess DataOps tools and marketing claims, it’s important to understand what is required for a successful DataOps program.
Fundamentally, any DataOps solution should enable you to eliminate errors, speed new feature deployment, and improve collaboration — using any toolchain. In this Buyer’s Guide, we boil it down to the basics to help you choose the right enabling tools for your program.
The DataOps Checklist
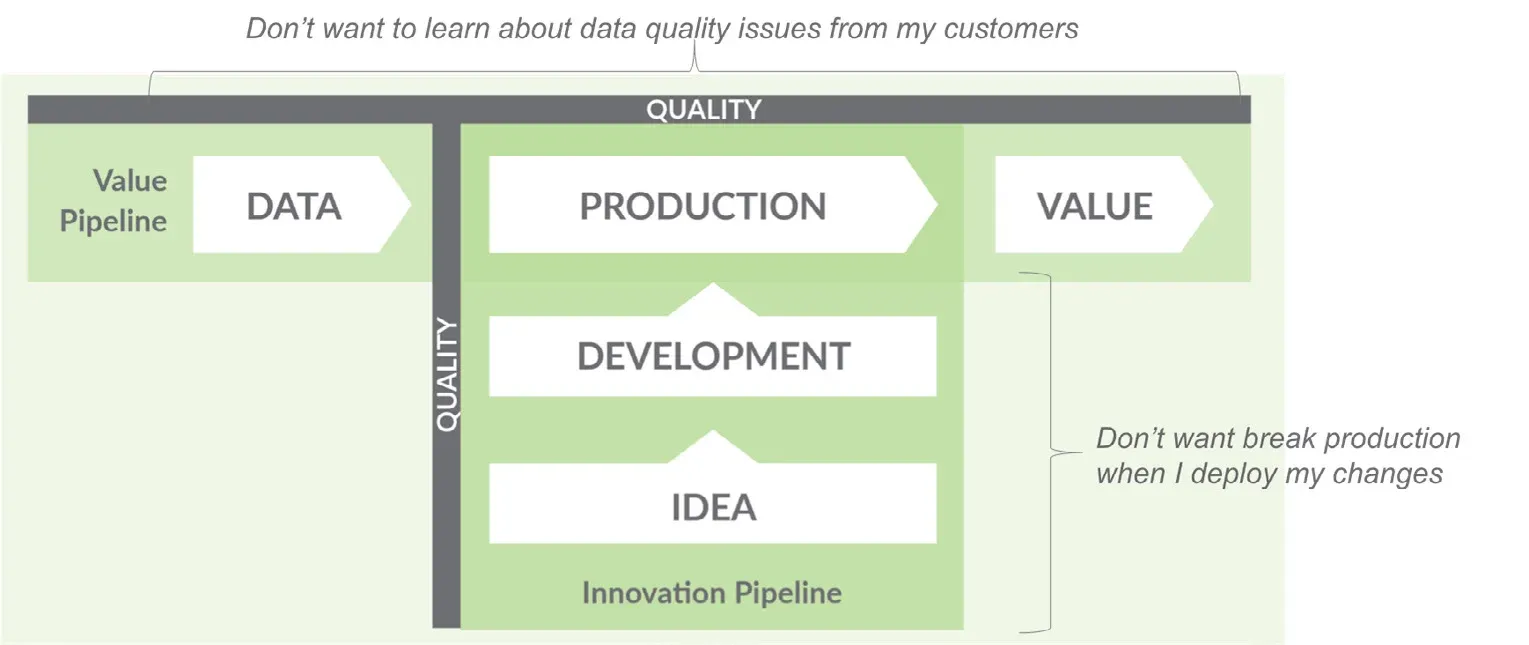
One common misconception about DataOps is that it is just DevOps applied to data analytics. Yet DataOps reflects the unique complexities of data teams. DataOps has to manage a significantly more complicated development and deployment lifecycle (innovation pipeline). And unlike in software development, data and analytics also has a dynamic production data operations pipeline (value pipeline) which must be constantly monitored. Figure 1 illustrates the two pipelines of DataOps.
To be successful, look for the following six core capabilities when selecting DataOps tools.
Data Observability
To eliminate errors and build trust in the quality of your data, both your production and development pipelines must be tested and monitored.
Continuous Production Monitoring
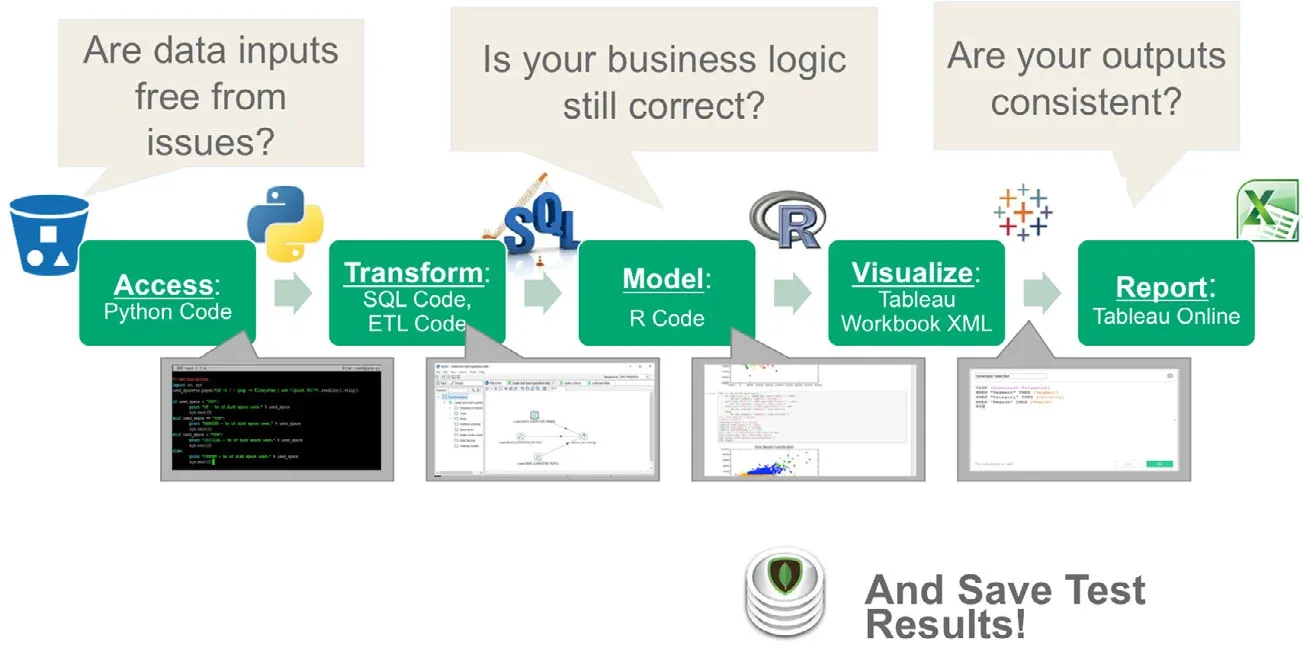
The easiest and fastest way to get started with DataOps is to focus on eliminating errors in your production pipelines. The production pipeline takes data and transforms it to create value for the organization. If you think of data analytics as a manufacturing pipeline, there are inputs (data sources), processes (transformations), and outputs (analytics). A typical manufacturing process includes tests at every step in the pipeline that attempt to identify problems as early as possible. Similarly in data and analytics, continuous testing is critical to prevent data pipeline errors from ruining operational analytics or customers finding quality issues (Figure 2). For success, you need to add a wide depth and breadth of tests (e.g., location balance, historical balance, and statistical process control) at every step of your existing production pipelines.
Development Testing
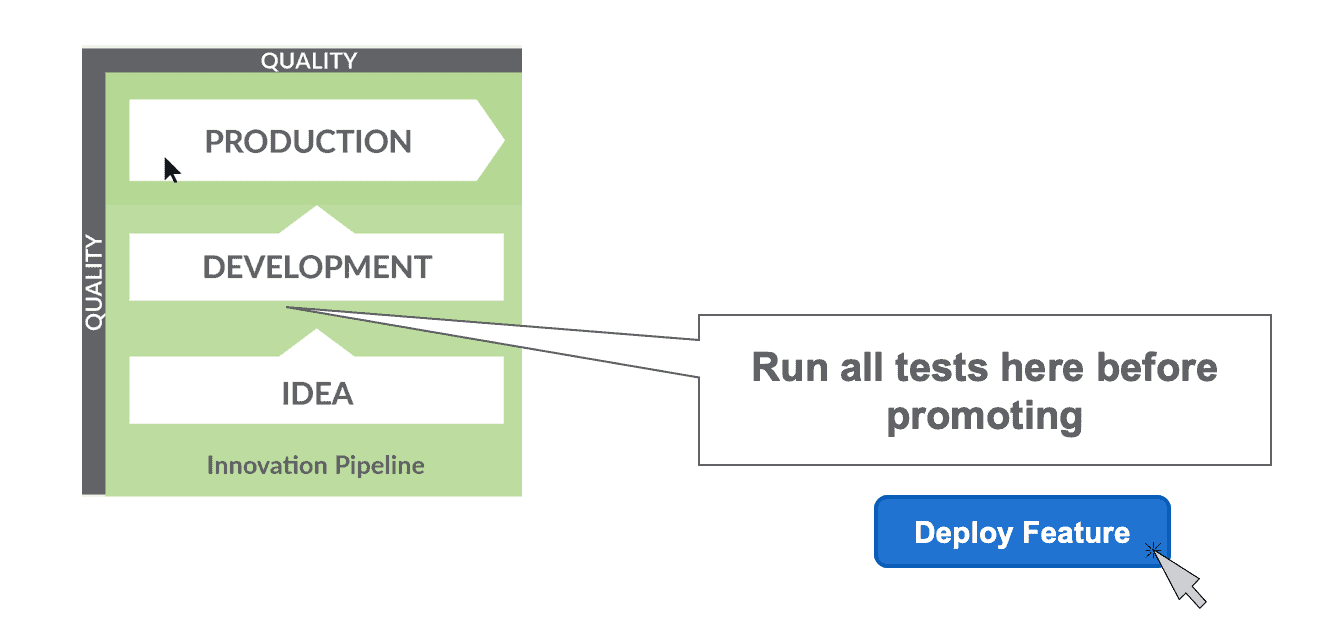
The Development pipeline is the collection of processes that create new analytics, similar to that of software development. Without an integrated test and alerting framework one would have to integrate multiple quality, testing, reporting, and storage tools together to form a comprehensive testing and reporting/monitoring system. To make sure that deployed changes do not break or create errors in data operations, you need to be able to build automated testing into your release and deployment workflows with minimal process changes (Figure 3).
Meta-Orchestration
System-Wide Orchestration (the DAG of DAGs)
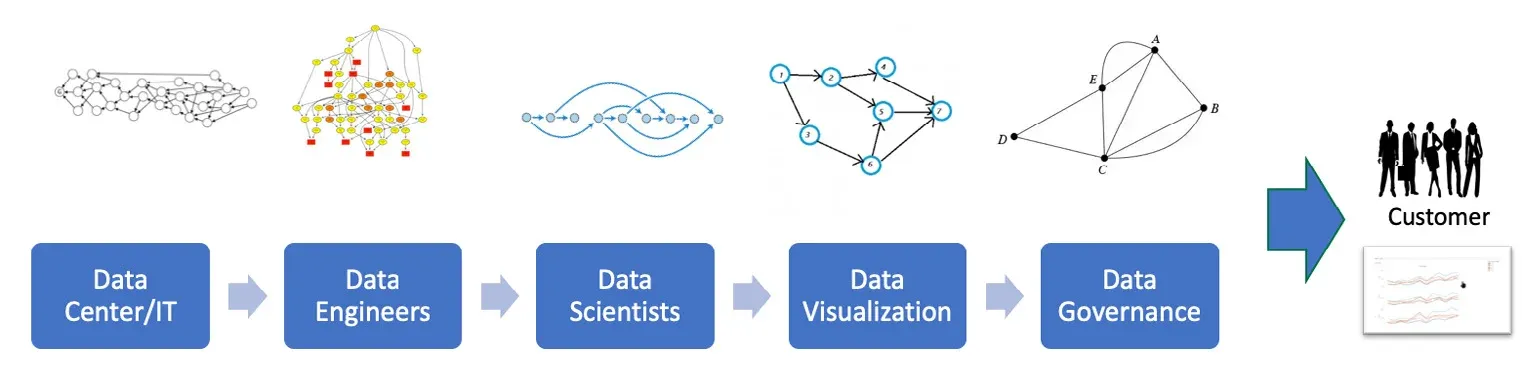
Think about your analytics like a factory assembly line process. As data moves through the system, it gets processed, transformed and assembled into charts, graphs, and other analytics. These workflows can be represented as a series of steps in a directed acyclic graph (DAG). Each node in the DAG represents a step in your process. The data production pipeline is actually a hierarchy of pipelines or a DAG of DAGs (Figure 4). For example, data engineering, data science, visualization, and governance steps of data operations all consist of sub-pipelines. The sub-pipelines can be further subdivided into sub-sub-pipelines. While many attempt to use DevOps and workflow orchestration tools, these tools lack an intelligent, system-wide production orchestration capability. DataOps meta-orchestration is specifically designed to handle the complexity inherent in data analytics pipelines that span numerous toolchains.
Test-Informed Orchestration
DataOps requires the orchestration of pipelines that integrate with testing, monitoring, and real-time alerts. The powerful combination of orchestration and observability is a major tenet of DataOps — “observable orchestration.” As large quantities of data flow through the data factory, tests at each stage of the pipeline ensure that input, outputs, and business logic are valid. Tests provide an unparalleled level of transparency into data operations. Look for meta-orchestration tools that natively support observability requirements.
Environment Creation and Management
On-Demand Infrastructure
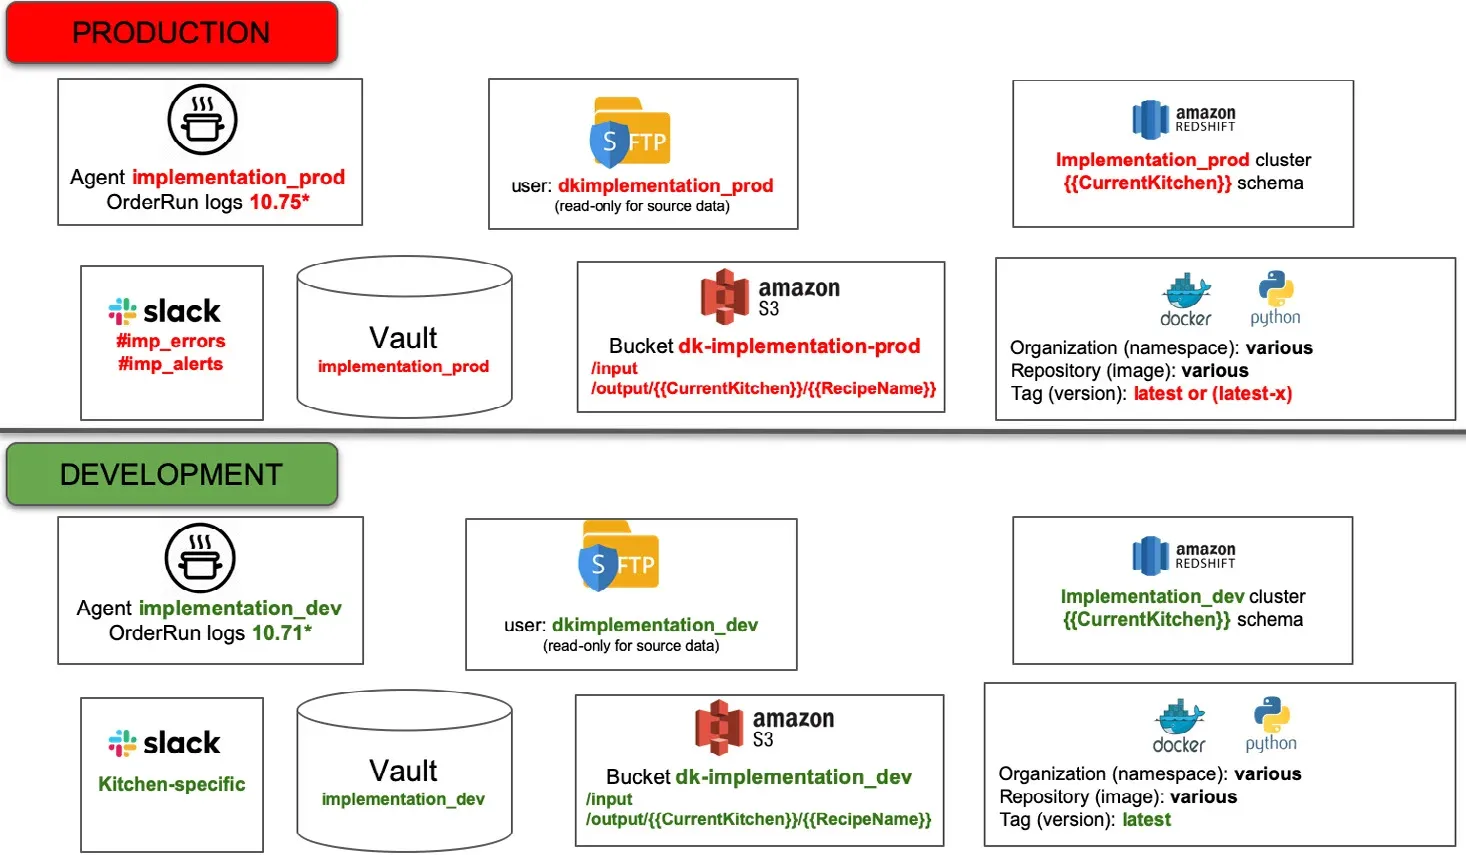
Developers and self-service users need safe controlled environments to quickly, confidently, and safely experiment and develop new data products. However, creating analytic development environments is extremely complex. It requires the joining of test data, hardware-software environments, version control, toolchains, team organization, and process measurement. Look for tools with wizards that enable you to easily abstract environments that contain everything users need to create and innovate (Figure 5).
Version Control
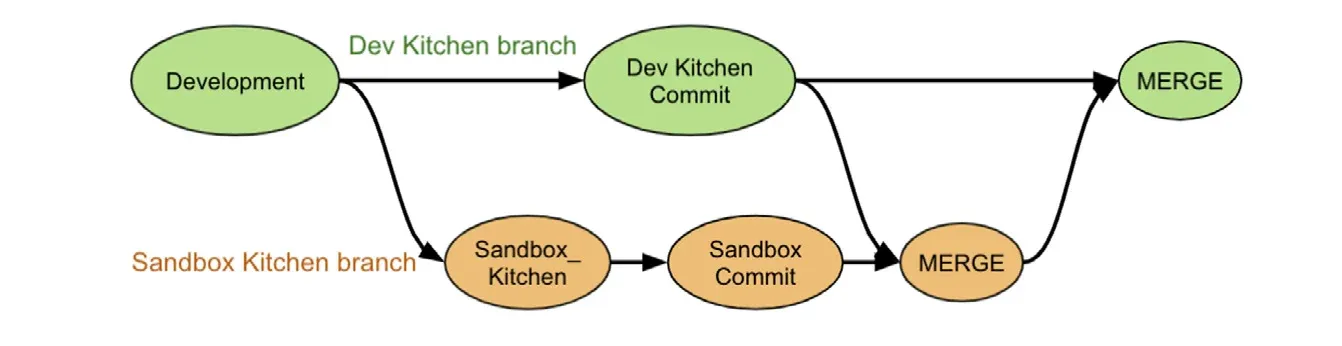
To prevent developers from overwriting each other’s work and to track changes, they need to be able to branch and merge their work. DataOps tools should integrate version control capabilities (such as Git) into their on-demand sandbox environments (Figure 6).
Test Data Management Capabilities
A DataOps solution must be able to create test data and ensure that the data is of the highest possible quality. Poor quality test data is worse than having no data at all since it will generate results that can’t be trusted. Another important requirement for test data is fidelity. Test data should resemble, as closely as possible, the real data found in the production servers. Finally, the test data management process must also guarantee the security and privacy of test data.
Continuous Deployment
Continuous Integration/Deployment (CI/CD for Data)
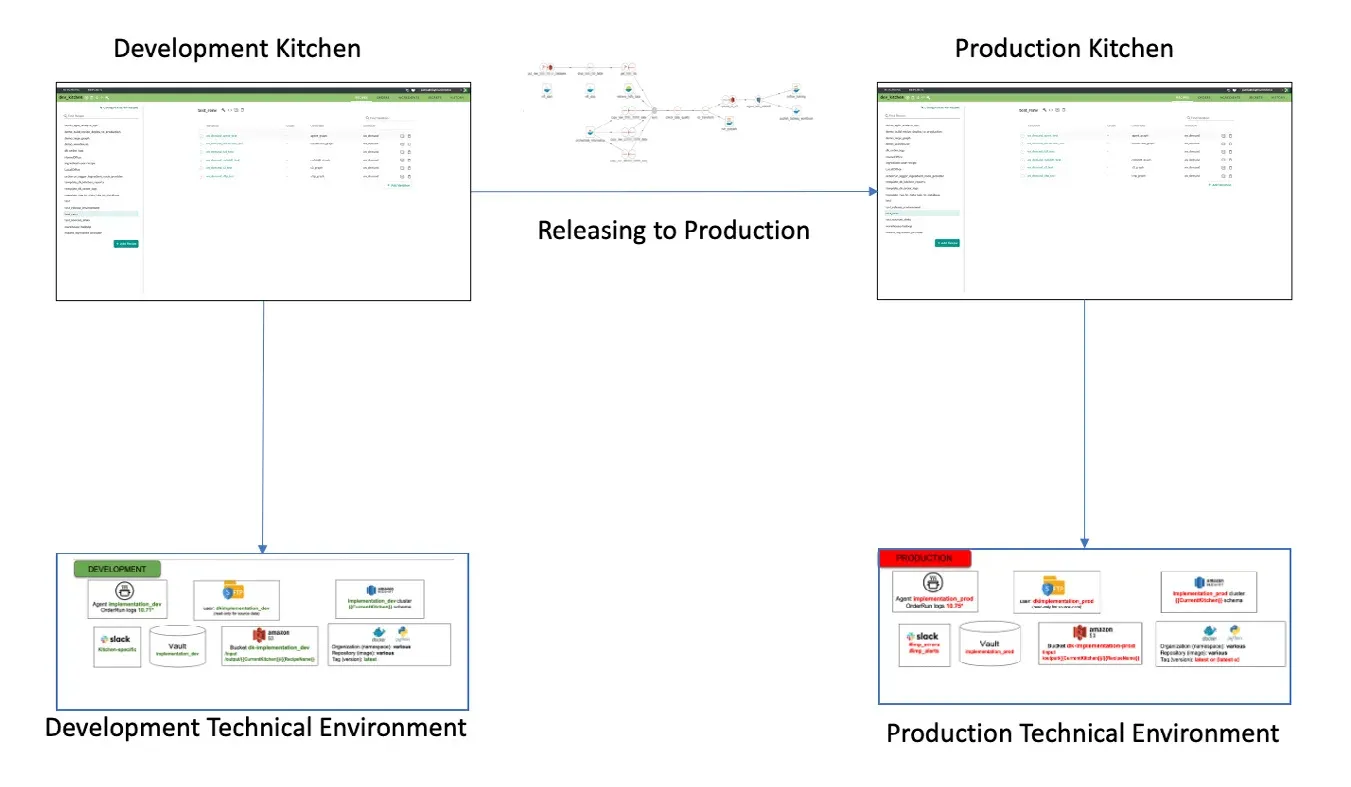
Parallel environments greatly ease the transition of analytics between co-workers or from a development sandbox to production. When development and production sandboxes are aligned, analytics can be deployed without the time consuming and risky manual effort of porting code to the production environment. Look for solutions that enable you to seamlessly remap analytics to new toolchain instantiations and deploy with the push of a button (Figure 7).
Collaboration and Sharing
Local Control with Centralized Management
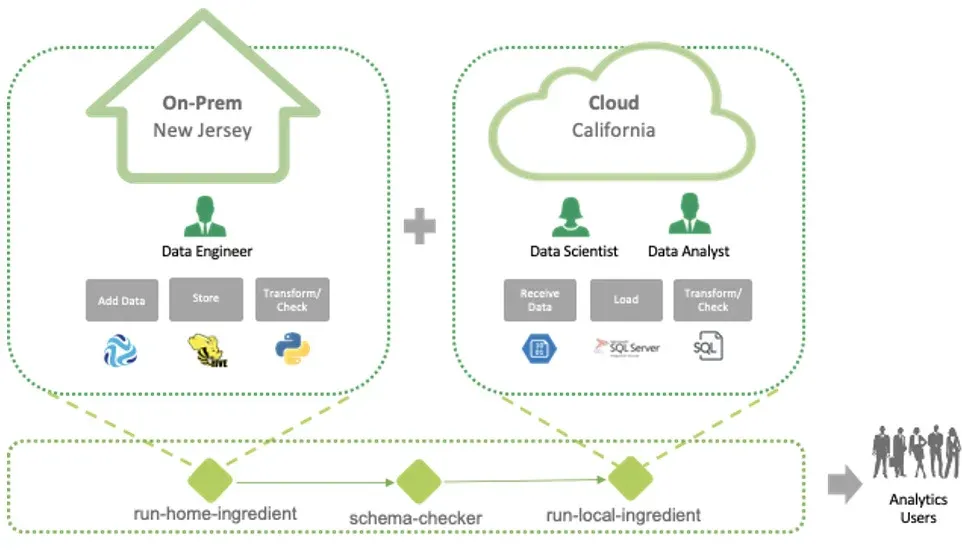
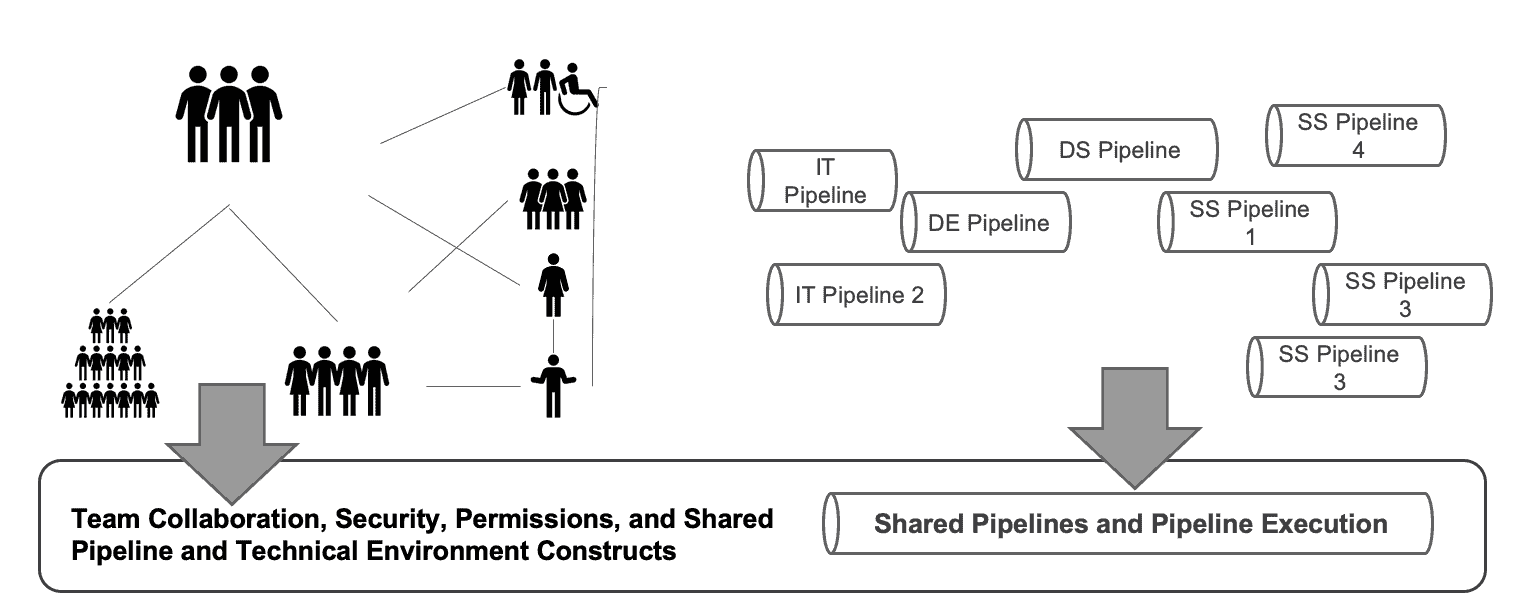
Data and analytics teams under one data enterprise manage many toolchains with analytics spread across many different technical platforms. A system-level view and process to manage that complexity are enormously difficult to achieve. A DataOps tool should unify a diverse mix of technical architectures. It should serve as the hub that enables all the people and toolchains to work together, as well as provide a single view of the entire analytic system (Figure 8).
Reuse and Sharing
Collaboration is enhanced when the team can create reusable components that can be shared with others or copied and edited. Look for DataOps tools that give your team the ability to share and reuse ideas, environments, and processes. DataKitchen ‘Kitchens’ promote collaboration by making it easy to create reusable components that can be shared, copied, and edited. Users can run the different analytics components separately or together in a single process.
Process Analytics
System-Wide Process and Performance Data Collection and Reporting Capability
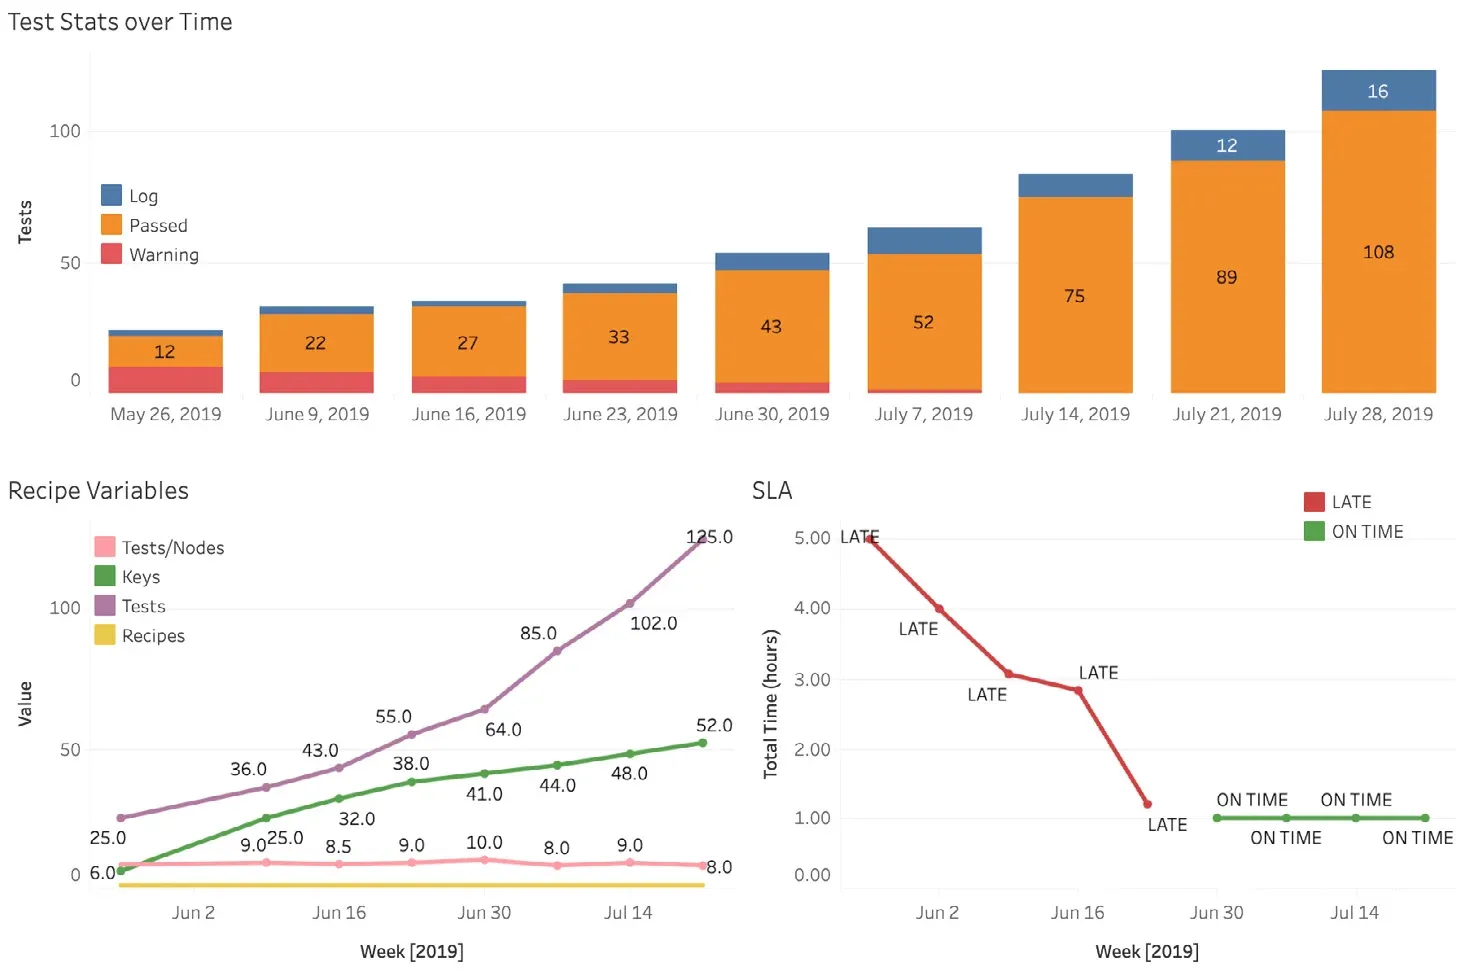
Process measurement is key for improving data workflows and operations. Although many analytics tools provide tool-specific data and logs, DataOps requires one combined data store with system-wide process metrics for the analytic system as a whole. This unified approach facilitates the collection, governance, and reporting of process lineage and other operational metrics, including data on collaboration, productivity, errors, and deployment time — all of which can be used to consistently improve quality and reduce delivery time. Data and analytics teams will be left in the dark about the performance of their systems, teams, and processes without a system-wide process and performance data collection and reporting capability (Figure 9).
Continuous DataOps Lifecycle
The data and analytics lifecycle is significantly more complicated than the software development lifecycle. The components of the DataOps lifecycle don’t easily lend themselves to a snappy acronym like CI/CD. In a “Continuous DataOps Lifecycle,” every aspect of the end-to-end data lifecycle should be automated. For success, continuous deployment must also operate as a single system with continuous meta-orchestration, continuous testing and monitoring, and continuous environments.
The Continuous DataOps Lifecycle provides a compelling case for the need for a DataOps Platform or “process hub”. For example, DevOps tools like Jenkins or Azure Pipeline can help with the CI/CD portion of the problem, but the rest would require a great deal of customization and maintenance. Look for a platform that ensures that continuous environments, meta-orchestration, testing, deployment, monitoring — everything on the DataOps checklist — all operate together as one coherent system. This coordination enables new analytics to seamlessly migrate to production and run successfully without errors or side effects.
Getting Started with DataOps
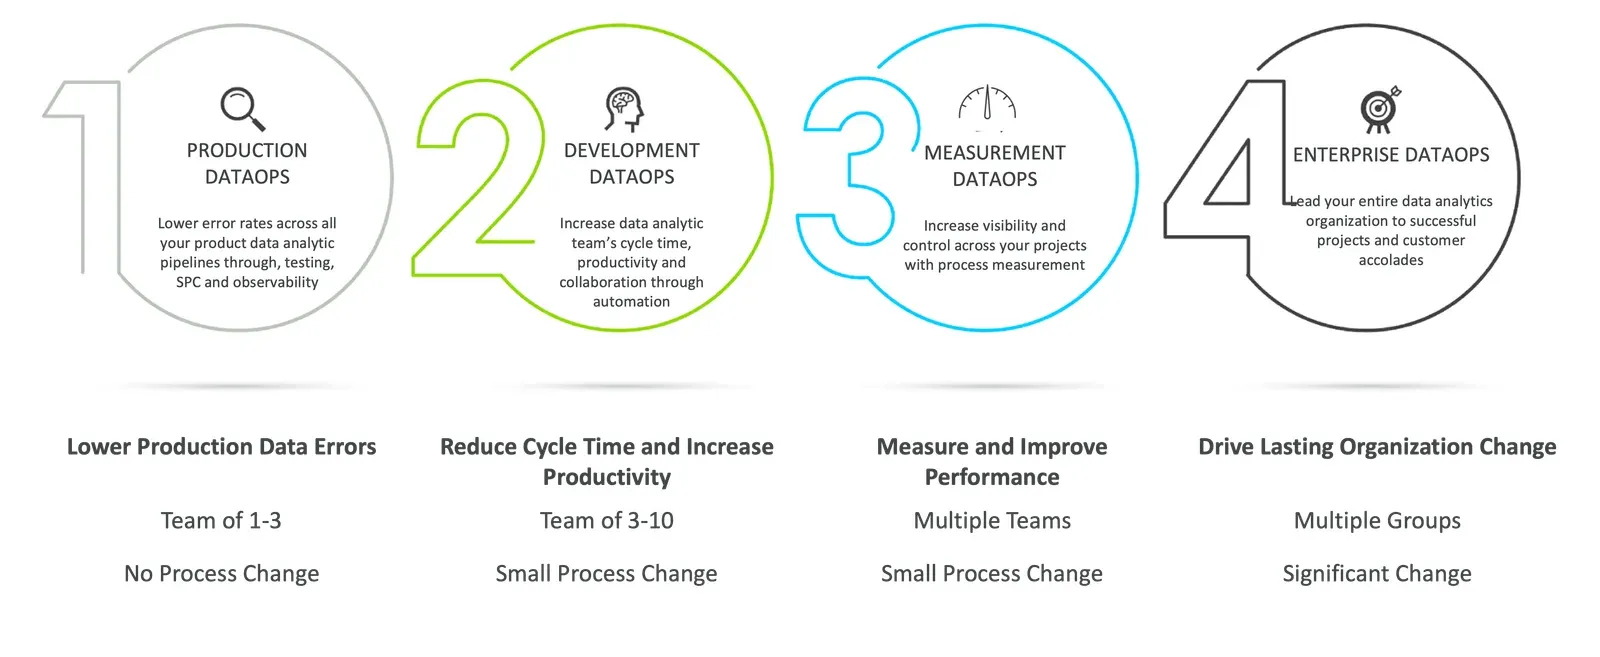
A DataOps Platform also makes it easy to get started with DataOps because you can build your program incrementally. DataKitchen advocates following a Lean DataOps approach — implementing DataOps in small steps that complement and build upon existing workflows and data pipelines.
The first phase is to implement DataOps for your existing Production pipelines in order to create a highly-observable, error-free analytic factory of insight. With no changes to your existing processes, Continuous Monitoring capabilities can be integrated with your existing pipelines to eliminate errors.
When you are ready, you can expand DataOps to your Development pipelines to accelerate analytic cycle time and reduce deployment risk. This is achieved with some small process changes and DataOps capabilities such as Environment Creation, Continuous Deployment, Meta-Orchestration, and Collaboration.
After achieving success in your Production and Development pipelines, you next can start measuring your results and making improvements to your processes with Process Analytics. And then when all of these processes are running smoothly, a DataOps Platform enables you to expand DataOps across the enterprise with ease.
DataOps Vendor Landscape
You will find tools that focus on one aspect of the DataOps system and tools that take a broad lifecycle view. There are also analytic toolchain vendors that include some DataOps functionality and others that market DataOps capabilities but don’t include any DataOps functionality at all. DataOps vendors can be organized into the following categories. See our DataOps vendor landscape for more detail.
- Complete end-to-end, tool-agnostic DataOps platforms (e.g., DataKitchen)
- Point DataOps solutions (e.g. dedicated data observability/testing tools)
- Data Management or Data Governance tools that include some DataOps functionality
- Data Management or Data Governance tools with no DataOps functionality, but marketed as DataOps
We believe that an end-to-end DataOps Platform provides the ‘process hub’ required for successful DataOps. It provides a solid foundation for executing the key DataOps capabilities with minimal investment of time and energy. Our experience is that organizations that attempt to cobble together or build their own DataOps system fail to meet their DataOps goals due to the complexity of system requirements. Also, they waste valuable staff resources.
The reality for most teams is that the fastest and most cost-effective way to realize the benefits of DataOps is to adopt an off-the-shelf DataOps Platform like DataKitchen. DataKitchen connects a cacophony of tools and processes into one cohesive system, removing that burden from the data team and enabling them to get back to doing what they do best — developing innovative analytics that deliver business value.
Related Reading
- What is DataOps? — the discipline this checklist is built from
- What is DataOps Observability? — the first capability on the list, in depth
- 7 Steps to Implement DataOps — the engineering practices behind the checklist
- Data Quality: The DataOps Way — how the same thinking applies to data quality
- DataOps Observability — monitoring the production value pipeline
- DataOps Automation — meta-orchestration, environments, and deployment
- The DataOps Vendor Landscape — who sells what, by category
FAQ
What is the main point of this paper?
Because DataOps is popular, vendors exaggerate their DataOps capabilities, and buyers need a checklist rather than a category label. Any real DataOps solution must let a team eliminate errors, speed new feature deployment, and improve collaboration using any toolchain, and it delivers that through six core capabilities: data observability, meta-orchestration, environment creation and management, continuous deployment, collaboration and sharing, and process analytics.
What are the six core capabilities of a DataOps solution?
Data observability, meta-orchestration, environment creation and management, continuous deployment, collaboration and sharing, and process analytics. Each one maps to a concrete requirement: tests in production and development, orchestration across toolchains, on-demand sandboxes with version control and test data, push-button deployment, a single view of a diverse technical architecture, and system-wide process metrics in one store.
Why is DataOps not just DevOps for data?
DataOps reflects the unique complexities of data teams. It has to manage a significantly more complicated development and deployment lifecycle, and unlike software development, data and analytics also has a dynamic production data operations pipeline that must be constantly monitored. DevOps tools address the deployment half of that problem and leave the running data factory unwatched.
What are the value pipeline and the innovation pipeline?
The value pipeline is production: it takes data and transforms it to create value for the organization, and it runs continuously. The innovation pipeline is development: the collection of processes that create new analytics, similar to software development. DataOps addresses both, which is why a solution that covers only one of them is incomplete.
What is meta-orchestration, and why is a workflow scheduler not enough?
A data production pipeline is a hierarchy of pipelines — a DAG of DAGs — where data engineering, data science, visualization, and governance steps each consist of sub-pipelines. DevOps and workflow orchestration tools lack an intelligent, system-wide production orchestration capability. Meta-orchestration is designed specifically for pipelines that span numerous toolchains.
What is observable orchestration?
Observable orchestration is the combination of orchestration with testing, monitoring, and real-time alerts, and it is a major tenet of DataOps. As large quantities of data flow through the data factory, tests at each stage verify that inputs, outputs, and business logic are valid. Look for meta-orchestration tools that natively support observability requirements rather than bolting them on.
What does a DataOps solution need for environment management?
Creating analytic development environments is extremely complex because it requires joining test data, hardware-software environments, version control, toolchains, team organization, and process measurement. Look for tools with wizards that abstract an environment containing everything a user needs to create and innovate, so developers and self-service users get safe, controlled space to experiment on demand.
Why does test data management belong on a DataOps checklist?
A DataOps solution must be able to create test data and ensure it is of the highest possible quality, because poor quality test data is worse than no data at all — it produces results that cannot be trusted. Test data also needs fidelity, resembling production data as closely as possible, and the process must guarantee security and privacy.
What does continuous deployment mean for data and analytics?
Parallel environments ease the transition of analytics between co-workers or from a development sandbox to production. When development and production environments are aligned, analytics deploy without the time consuming and risky manual effort of porting code. Look for solutions that seamlessly remap analytics to new toolchain instantiations and deploy with the push of a button.
What is DataOps process analytics?
Process analytics is a system-wide process and performance data collection and reporting capability. Many analytics tools provide tool-specific data and logs, but DataOps requires one combined data store with system-wide process metrics — process lineage, collaboration, productivity, errors, and deployment time — that teams use to consistently improve quality and reduce delivery time.
What is the Continuous DataOps Lifecycle?
The data and analytics lifecycle is significantly more complicated than the software development lifecycle, and it does not reduce to a snappy acronym like CI/CD. In a Continuous DataOps Lifecycle, every aspect of the end-to-end data lifecycle is automated, and continuous deployment operates as one system alongside continuous meta-orchestration, continuous testing and monitoring, and continuous environments.
What are the four categories of DataOps vendors?
Complete end-to-end, tool-agnostic DataOps platforms; point DataOps solutions such as dedicated data observability and testing tools; data management or data governance tools that include some DataOps functionality; and data management or data governance tools with no DataOps functionality at all that are marketed as DataOps. The last category is why a capability checklist matters.
Should you build or buy a DataOps solution?
Organizations that attempt to cobble together or build their own DataOps system generally fail to meet their DataOps goals, because of the complexity of the system requirements, and they waste valuable staff resources doing it. For most teams the fastest and most cost-effective route is an off-the-shelf DataOps platform that acts as the process hub connecting existing tools.
How should a team get started with DataOps?
Build incrementally. Implement DataOps on existing production pipelines first, since continuous monitoring integrates with no changes to existing processes and immediately eliminates errors. Then extend to development pipelines to cut cycle time and deployment risk, then add process analytics to measure and improve, and only then expand across the enterprise.
Get the PDF
The full guide is on this page. Fill in the form for a PDF copy to keep or share.